










Product: Ascend Consultancy

  • How fleet renewal is reshaping aircraft utilization

    Team Perspective

    Povilas Stonys, Aviation Valuations & Consultancy Associate, Cirium Ascend Consultancy

    With input from Richard Evans, Senior Consultant, Cirium Ascend Consultancy

    Fleet renewal is reshaping not only what airlines fly, but how intensively they use different aircraft across their fleets. Average aircraft utilization is a key productivity indicator, which has generally increased over time as airlines have become more efficient. It is also an important metric to help understand supply and demand balance. Using Cirium Fleets Analyzer data, this article examines how utilization trends differ across passenger aircraft generations and age groups, highlighting the growing divide.

    Flying the future: new-generation aircraft lead utilization trends

    While average flight hours declined across all major passenger aircraft types between June 2025 and June 2026, new-generation aircraft consistently maintained higher utilization levels and saw smaller reductions than their legacy counterparts, see the table below.

    Aircraft TypeAverage Flight Hours Jun-25Average Flight Hours Jun-26YoY Change %
    737 NG262242-7.5%
    737 Max-8304301-1.3%
    A320ceo253232-8.3%
    A320neo280266-4.9%
    A321ceo271247-8.9%
    A321neo307294-4.1%
    777-300372355-4.8%
    787-9381370-2.9%
    A330-300308292-5.0%
    A350-900385381-1.1%

    Source: Cirium Fleets Analyzer; Airbus and Boeing passenger aircraft only

    New-generation narrowbodies recorded an average utilization decline of approximately 3%, compared with around 8% for legacy aircraft, while new-generation widebodies declined by 2% versus 6% for older aircraft types. The contrast is particularly evident between utilization of the Boeing 737-NG, which fell 7.5% year-on-year to 242 hours per month between June 2025 and June 2026, and the 737-8 Max, which remained comparatively resilient, declining only 1.3% to 301 hours. A similar pattern is visible with Airbus A321neo, which not only operated roughly 19% more hours, but its utilization decline was less than half that of the A321ceo (-4.1% versus -8.9%). The A350-900 demonstrated the largest utilization advantage, with a gap of nearly 90 flight hours per month compared with the prior-generation A330-300, while the gap is narrower between the 787-9 and 777-300ER, new-generation types still maintain a utilization lead with a smaller year-on-year decline. Cirium’s data suggests that growth in total flight hours is being driven primarily by fleet expansion, alongside continued fleet renewal, as airlines increasingly favour new-generation aircraft.

    The mid-life squeeze: how fleet renewal is reshaping utilization

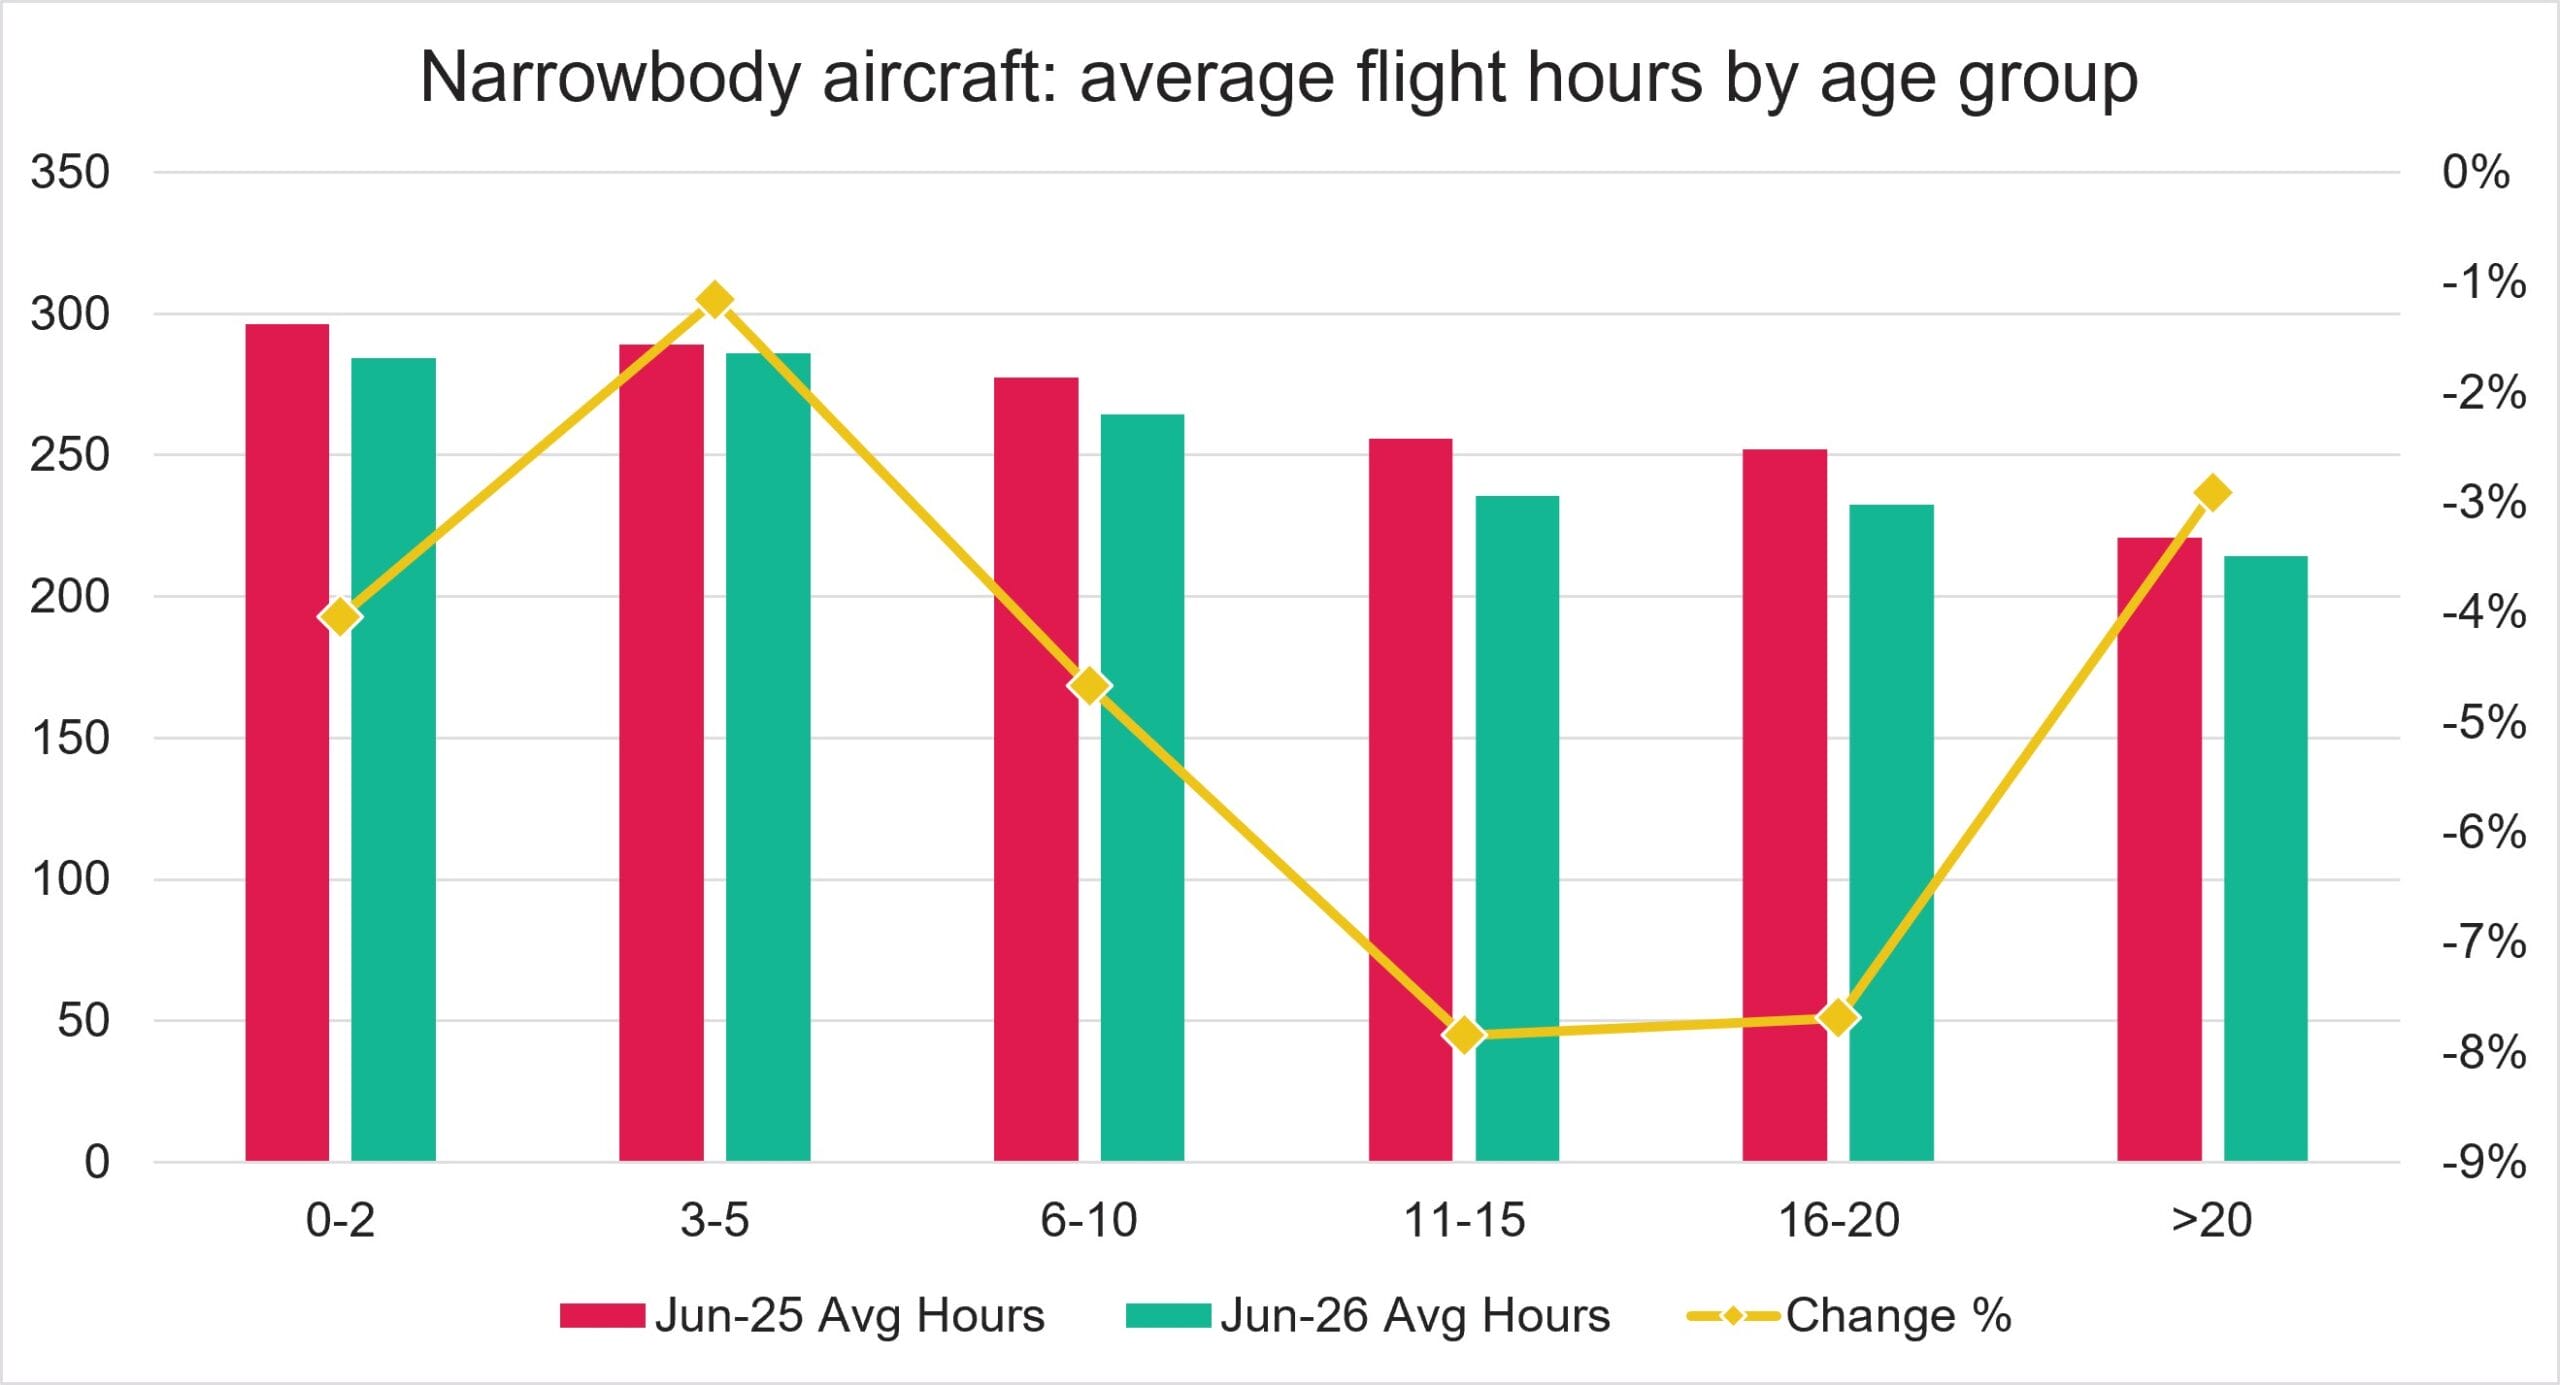
    Fleet renewal is not only visible between aircraft generations, but also across aircraft age groups. The data shows that aircraft utilization declined across all age groups, but the decline was not equal. The steepest reductions occurred among mid-life aircraft, suggesting airlines are becoming increasingly selective in strategic fleet allocations.
    Source: Cirium Fleets Analyzer; Airbus and Boeing passenger aircraft only

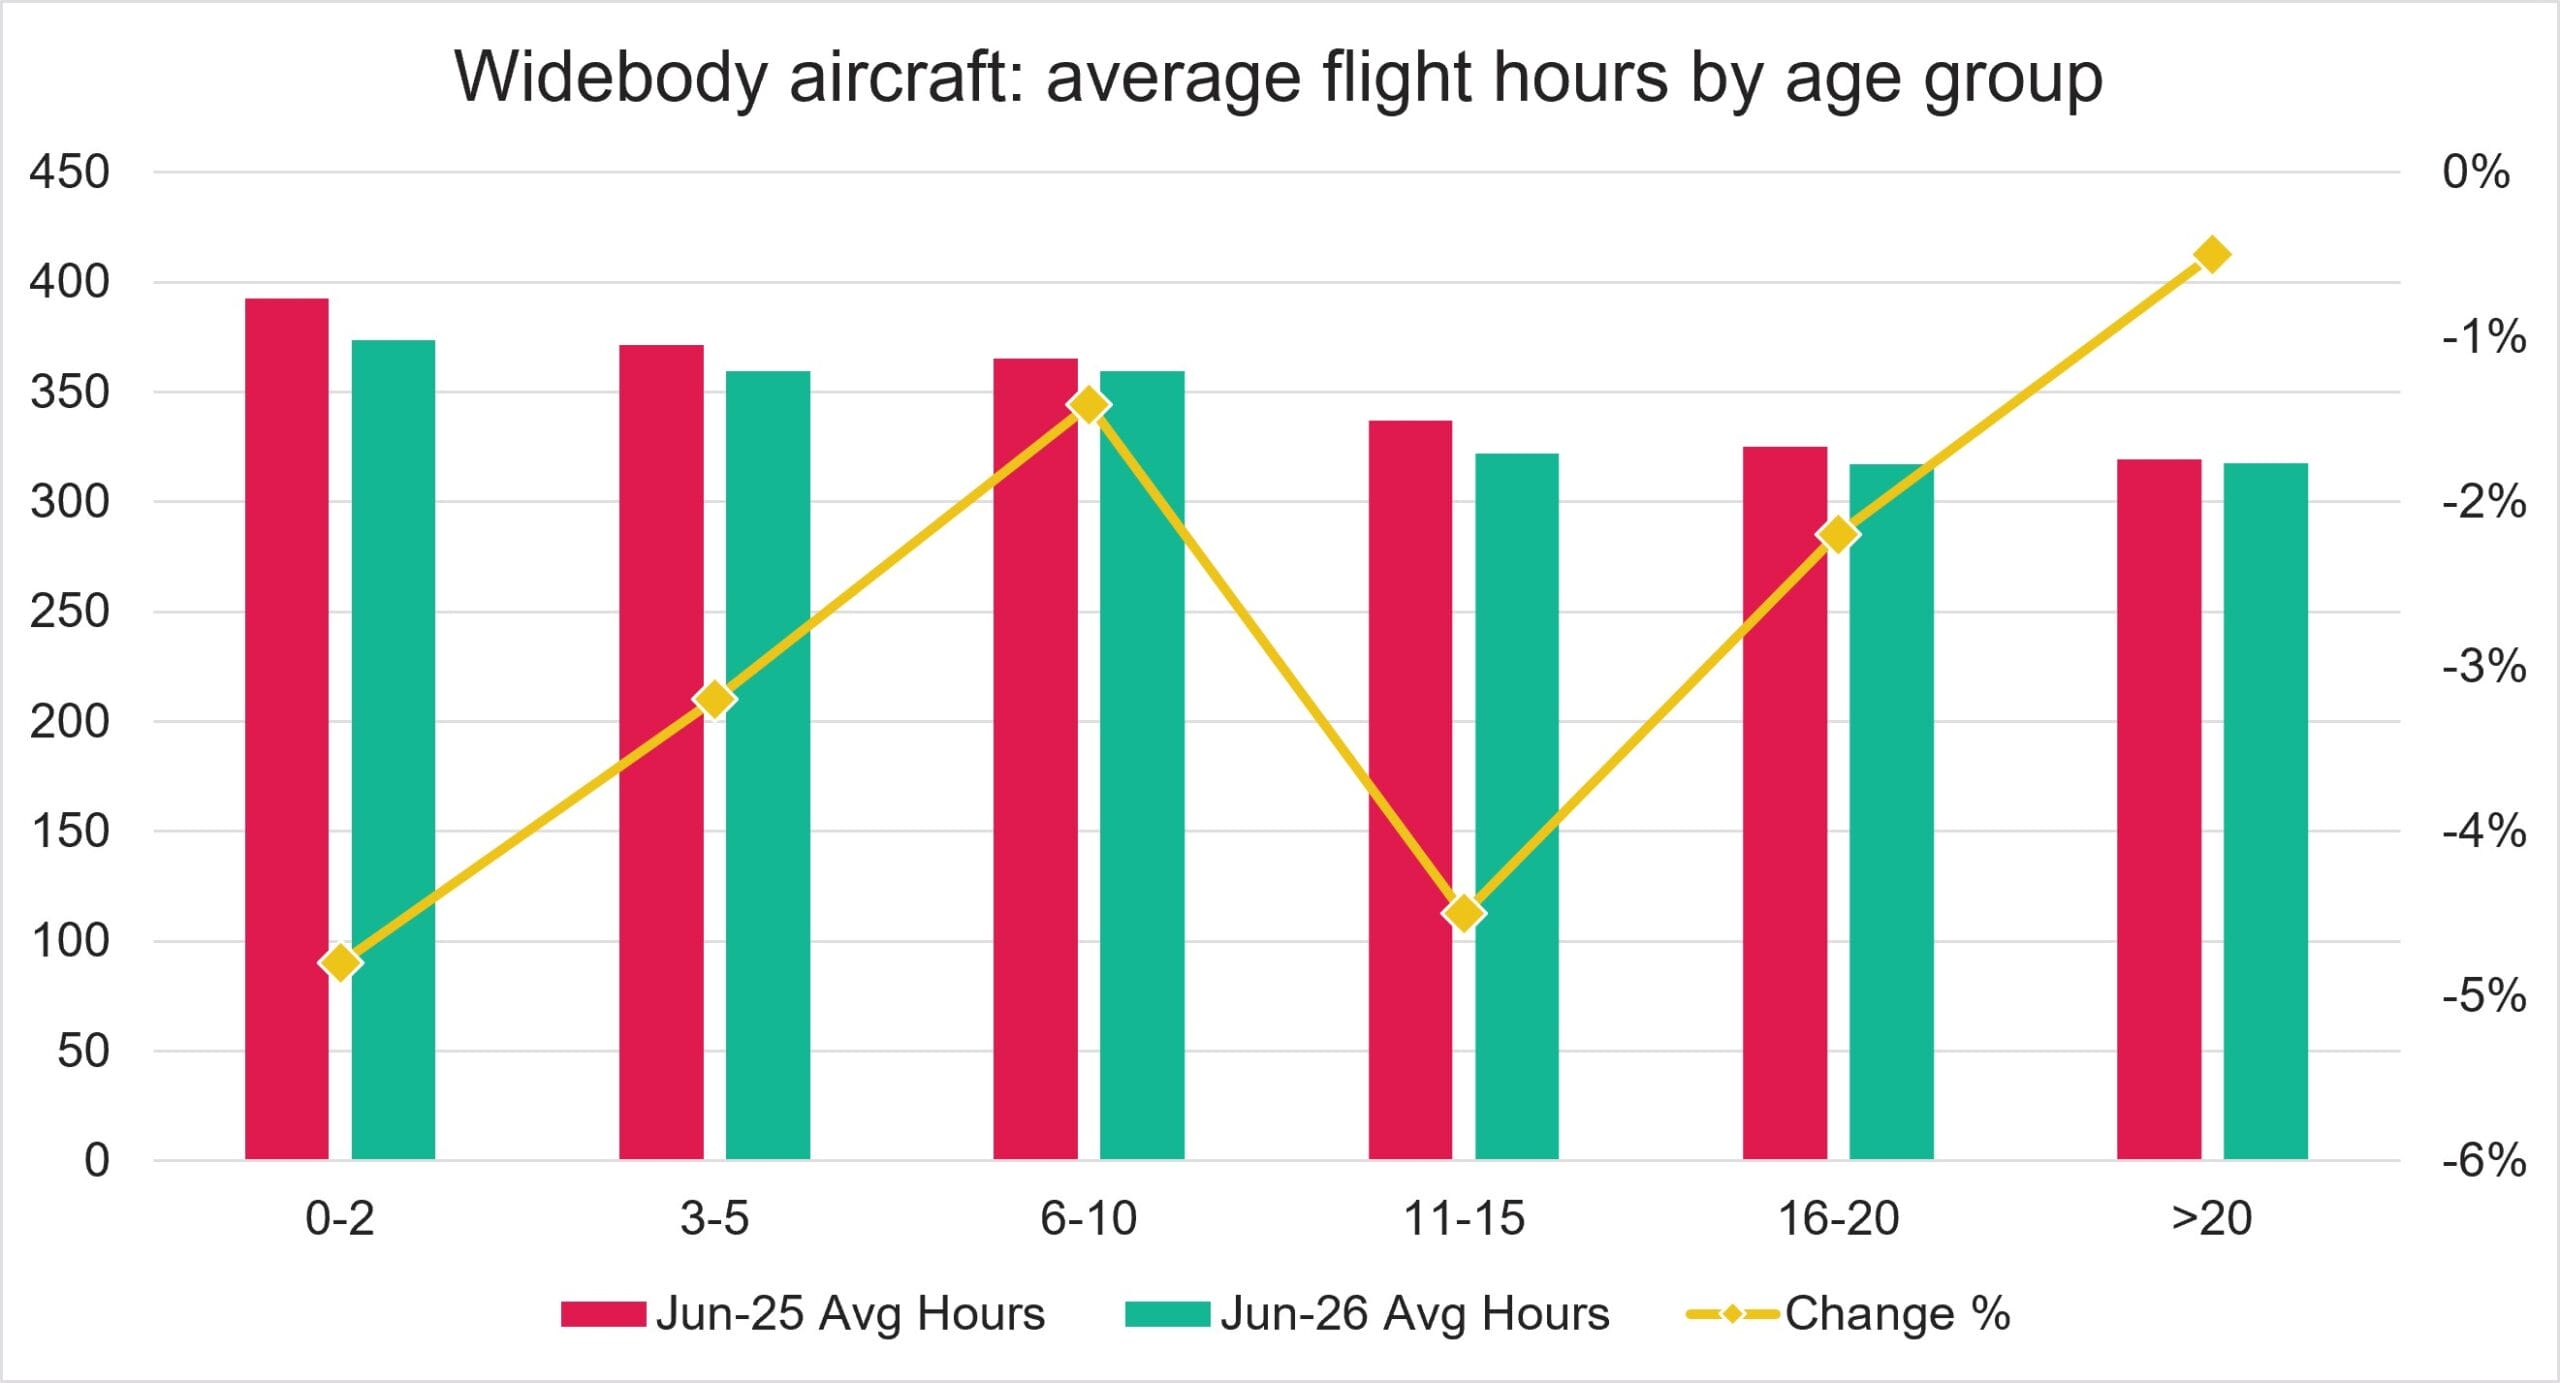
    The above chart indicates that narrowbodies aged 11-20 years recorded the sharpest decrease in average flight hours, at 7.8% respectively, compared with 1.2% for fleet aged 3-5 years. By comparison, widebodies showed a more gradual utilization profile across age groups, indicating that mid-life aircraft remain better integrated into airline networks. Nevertheless, 11-15-year-old aircraft experienced a decline in utilization with 4.5%, whereas aircraft aged over 20 years recorded the smallest reduction, declining by just 0.5%, see the chart below.
    Source: Cirium Fleets Analyzer; Airbus and Boeing passenger aircraft only

    The 11-20-year range appears to be in the industry’s “squeeze zone” which reflects a period where operators increasingly shift flying activity to new-generation aircraft while preparing mid-life fleets for replacement, lease returns, or retirement. Additionally, these aircraft often face heavy maintenance checks, which can further limit utilization. Cirium data challenges the conventional assumption that aircraft become less relevant simply as they age. The utilization profile increasingly resembles a barbell structure, with airlines concentrating flying activity at opposite ends of the aircraft age spectrum. New-generation aircraft continue to attract a growing share of flying activity, but the oldest aircraft demonstrated the greatest utilization resilience.  

    The survivor effect: older aircraft still earning their keep

    Fleet renewal is not eliminating older aircraft uniformly. Instead, a select group of prior generation aircraft types continues to thrive in targeted market segments where economics, performance, or lack of direct replacements support their longevity. In the table shown below, several aircraft over 20 years old recorded utilization growth between June 2025 and June 2026, led by 737-500 (+16%), 757-200 (+12%), A330-200 (+9%), and 757-300 (+8%).

    Utilization of passenger aircraft older than 20 years

    Aircraft TypeAverage Flight Hours Jun-25Average Flight Hours Jun-26Change %
    737-50011513416%
    757-20023726512%
    A330-2002833089%
    757-3002352548%
    777-300ER2222377%
    747-4002292311%
    767-4003613620%
    737-9001881880%
    A321237235-1%
    777-200364360-1%

    Source: Cirium Fleets Analyzer; Airbus and Boeing passenger aircraft only

    Aircraft that remain in service beyond 20 years are increasingly the best-maintained and most economically viable examples of their type. With average utilization of 234 flight hours which is already significantly below that of the youngest fleets (296 flight hours), these aircraft have reached a stable operating floor, supporting charter, leisure, regional, and specialist missions where replacement economics are less compelling.

    This proves that airlines are not reducing flying activity evenly across their fleets. Instead, utilization trends reveal a clear fleet-renewal story: new-generation aircraft are capturing a growing share of flying activity, while mid-life fleets are increasingly squeezed as carriers transition toward more efficient aircraft. Meanwhile, the oldest aircraft continue to demonstrate strong resilience in specialised operational roles.

  • Cirium Helicopter Forecast 2026: Resilience and Growth

    Sara Dhariwal, Senior Aviation Analyst, Lead Appraiser – Helicopters & AAM, Cirium Ascend Consultancy

    In contrast to the commercial airline sector’s cyclical nature, the civil helicopter market has continued to deliver resilience and stability over the past decade. The fleet shows growth despite the prolonged oil and gas downturn, the Covid-19 pandemic, ongoing instability in the geopolitical climate and persistent supply chain challenges. The market’s defining characteristic been consistent resilience, a trait that is likely to shape its trajectory over the next ten years.

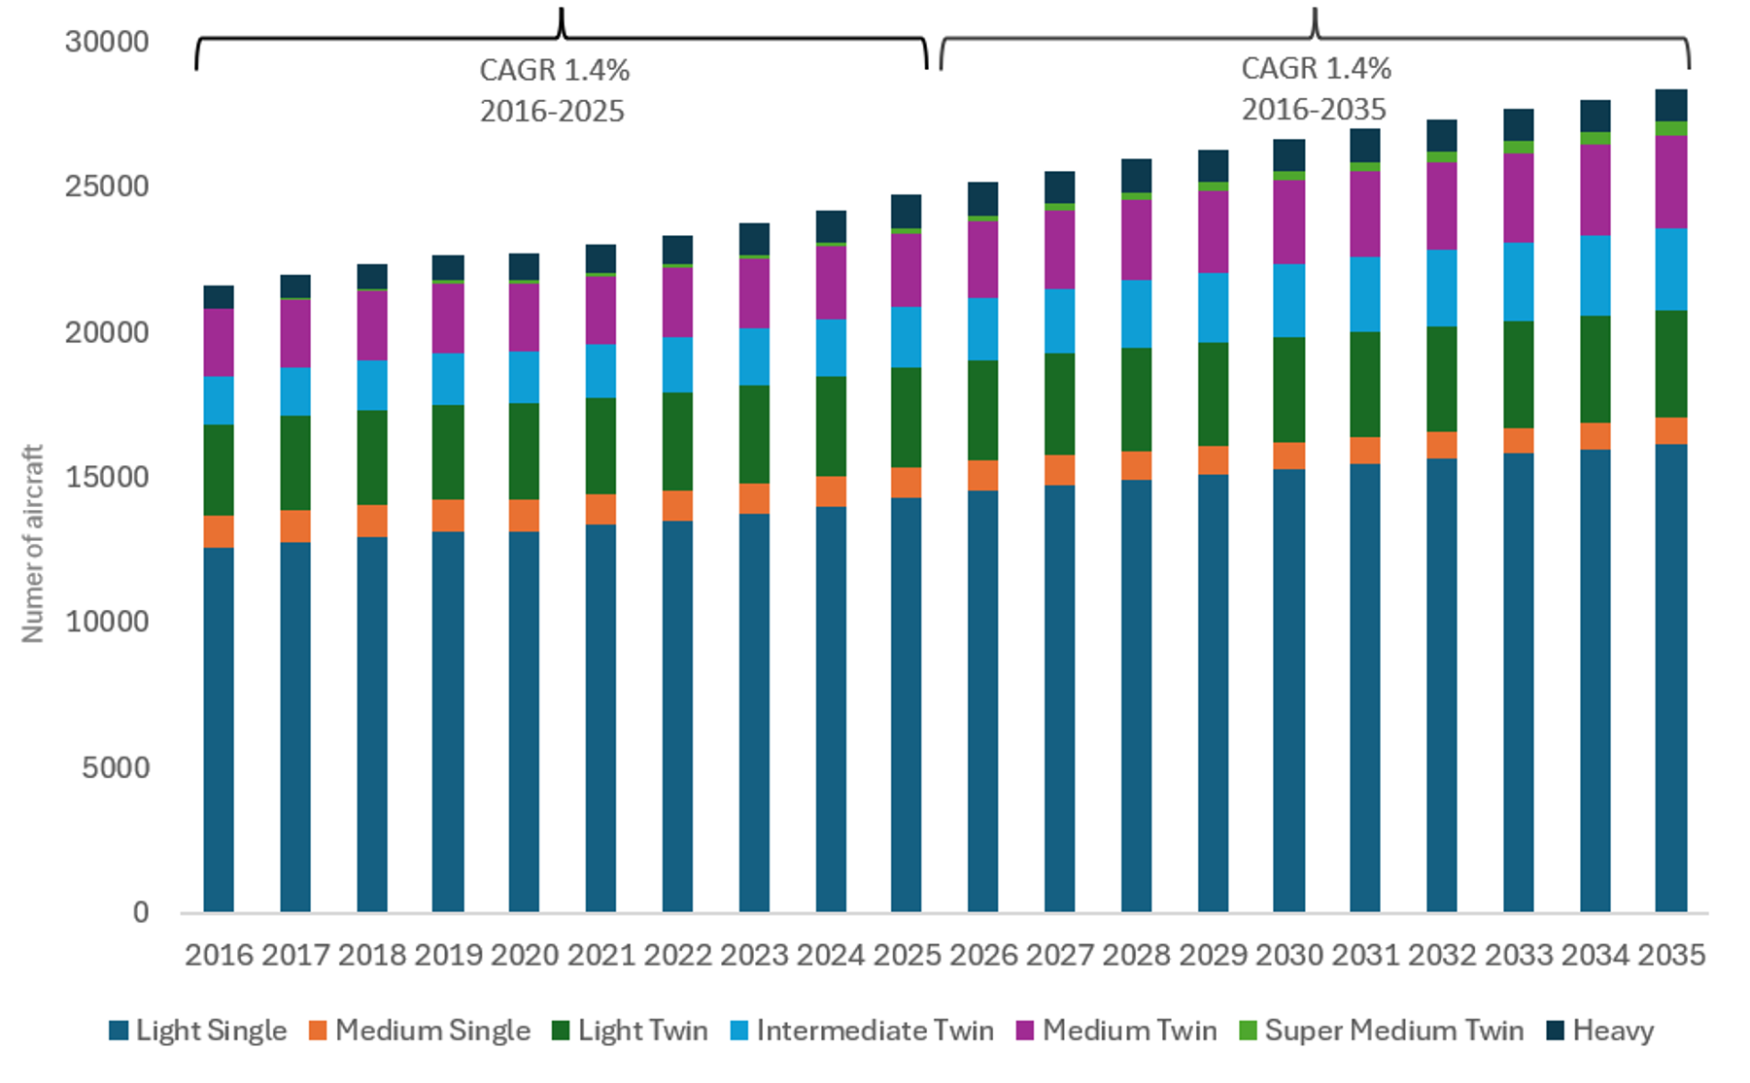
    The fleet has grown from roughly 21,600 aircraft in 2016 to 24,700 at the end of 2025, a CAGR of around 1.4%, and it grew in every one of those years, including 2020. In 2025 it added almost 540 aircraft, or 2.2%, the strongest rate of the decade.

    Cirium Ascend Consultancy forecasts around 7,640 new civil turbine helicopter deliveries worth some $56 billion over 2026–2035. Similar to the 2025 forecast, 53% of deliveries are predicted to be for replacement and 47% for growth. Consequently, the global fleet is projected to expand at around 1.4% annually, consistent with the trend observed over the previous decade.

    Chart 1: Fleet evolution 2016-2035

    Source: Cirium Helicopter Forecast 2026

    One of the helicopter market’s key strengths is the longevity of the assets. Around 90% of helicopters delivered over the past 30 years remain in existence, and the average in-service aircraft is now 33.5 years old with the oldest still flying over 60. That longevity underpins the strong residual-value retention that makes helicopters attractive to financiers.

    On the other hand, this longevity also reduces replacement pressure, as operators can often defer replacement for extended periods by extending service lives through overhaul and upgrades, rather than buying new. The result is a large pool of older aircraft that is ripe, but not required, for replacement. The past 10 years have recorded continuously low retirement rates at around 1% of the fleet each year. Cirium forecast the rate to continue at a modest 1.6% year on year with a replacement demand for some 4,010 helicopters. The expectation is that annual retirements will climb towards 500 by 2035.

    Overall, the next decade is expected to be driven by fleet renewal. A focus of the OEM’s will be to convert an ageing installed base into replacement orders, supported by new-generation products such as the H160, H140, AW09, R88 and Bell 525. Equally important will be the availability of financing solutions, with lessors likely to play an increasingly significant role in supporting fleet modernisation and fleet growth.

    Operating leasing has become an increasingly important source of financing within the helicopter sector. The leased fleet now approaches 1,000 aircraft, representing around 4% of the global fleet. SMFL’s acquisition of Macquarie Rotorcraft and LCI in 2025, resulting in approximately 60% of the leased fleet being controlled by two major lessors reflects the growing maturity of the leasing sector and the availability of substantial capital.

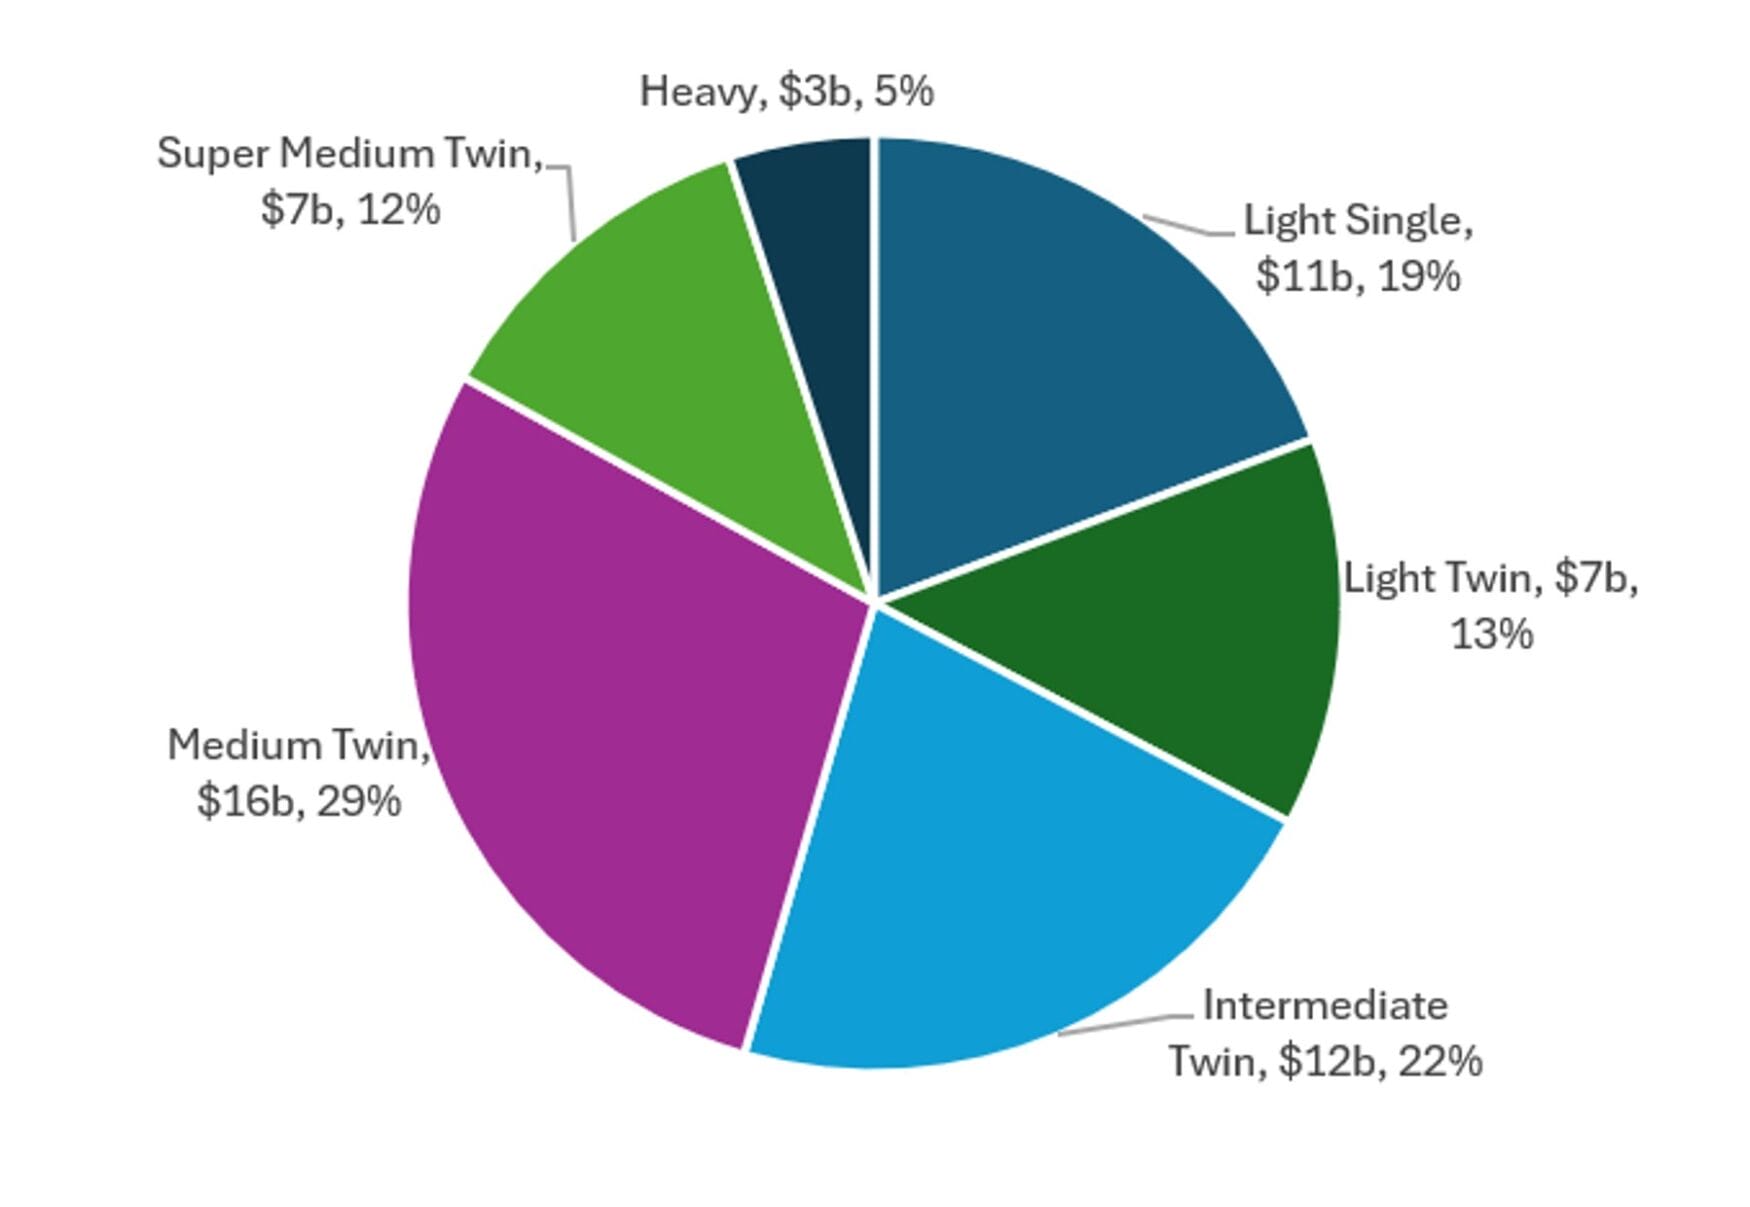
    In terms of deliveries, the focus will continue to be on Light Single-engine types which are forecast to take 53% of deliveries, sustained by sub-$2 million machines such as the Bell 505 and Robinson R66 and the workhorse H125. But volume and value tell different stories.

    Chart 2: Delivery value by segment

    Source: Cirium Helicopter Forecast 2026

    Medium Twins is expected to take just 14% of deliveries by volume but almost 30% by value — around $16 billion — led by the AW139 and the Airbus H160. By manufacturer, Airbus is forecast to lead with 47% of delivery value, ahead of Leonardo at 29% and Bell at 16%.

    Advanced Air Mobility (AAM) also remains an area to monitor. While around 15,000 provisional eVTOL orders have been announced and certification progress has been achieved in several programmes, the sector continues to face development and certification challenges.

    Indeed, the pattern of repeated certification delays looks strikingly familiar to anyone who has watched a conventional helicopter programme mature. Cirium’s view is that any meaningful impact on helicopter demand is unlikely before the 2030s, concentrated in selected air-taxi and light-utility niches.

    The helicopter market’s defining characteristic over the past decade has been resilience, and there is little in the current outlook to suggest that will change. The coming years are expected to be characterised by steady, replacement-led demand rather than transformational growth, with success hinging on the industry’s ability to translate a large and ageing installed base into fleet renewal. For OEMs, financiers and lessors alike, the opportunity lies not in creating demand, but in unlocking it. 

    ORDER THE REPORT

  • Indian Aviation: Softer Growth, Stronger Foundations (Pt. 2)

    Team Perspective

    Sabrina Ng, Senior Valuations Analyst, Cirium Ascend Consultancy

    In Part One, we explored how operational constraints, financial pressures and shifting market economics have prompted Indian airlines to recalibrate growth plans and reallocate capacity toward more profitable opportunities. Yet the recent slowdown tells only part of the story, and India’s long-term aviation outlook remains robust. The reason lies not only in demand fundamentals, but also in the rapid evolution of the financial and institutional framework supporting fleet growth.

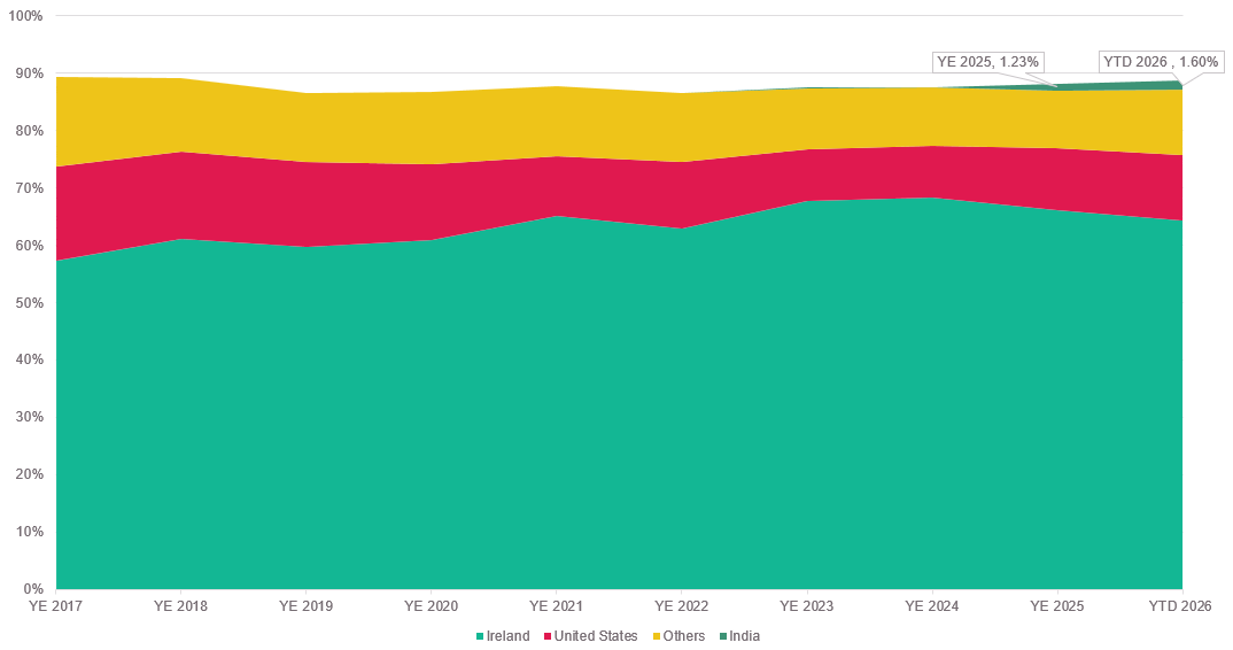
    GIFT City, home to India’s International Financial Services Centre (IFSC) and regulated by IFSCA, has emerged as an increasingly credible hub for aircraft leasing and financing. The development is particularly significant given that more than 85% of India’s commercial fleet is operated under lease, with the majority historically financed and owned through offshore leasing centres such as Ireland.

    Recent reforms have expanded GIFT City’s role beyond tax incentives, introducing a 20-year tax holiday, removing tax deduction at source (TDS) on qualifying lease rentals, and establishing dedicated frameworks for leasing SPVs, trustee services and corporate administration. Together, these reforms aim to provide lessors and financiers with greater tax certainty, improved cash-flow efficiency and internationally recognised financing structures that enhance creditor confidence. At the 2nd India Aircraft Leasing and Financing Summit in May 2026, it was reported that over 370 aviation assets worth approximately USD 5.8 billion had been leased through the IFSC framework, supported by more than 30 registered lessors. Indian carriers are increasingly sourcing leasing and financing capacity through GIFT City, including transactions involving SMBC Group and Standard Chartered, while institutions such as Natixis have established a local presence to participate in the market.

    Chart 1: Commercial aircraft operated by Indian airlines under lease, by lease owner jurisdiction

    Source: Cirium core, Fleets Analyzer, data filed on 24-Jul-2026

    Concurrently, India has narrowed the jurisdictional risk premium by putting the Cape Town Convention onto a statutory footing. The Protection of Interests in Aircraft Objects (PIAO) Act and its corresponding 2026 Rules explicitly override previous conflicts with the Insolvency and Bankruptcy Code (IBC) moratorium. By enforcing the Convention’s Alternative A remedy, including its two-month waiting period and mandated Irrevocable De-registration and Export Request Authorisation (IDERA) processing, these reforms have consolidated the Aviation Working Group’s earlier compliance upgrade and materially strengthened lessors’ confidence in their asset repossession rights. While the new framework has not yet been tested through a major airline insolvency, its significance lies in providing clear statutory support for Cape Town remedies and IDERA enforcement, addressing many of the legal uncertainties exposed by the Go First collapse.

    The combined framework is best illustrated by IndiGo’s landmark Japanese Operating Lease with Call Option (JOLCO) transaction covering two Airbus A320neo aircraft, arranged by SMFL on the equity side and SMBC on the debt side. As the first JOLCO ever closed through GIFT City, the deal demonstrates that foreign financiers, including traditionally risk-averse Japanese investors, are beginning to view the Indian regulatory and tax architecture as a credible framework for cross-border aircraft financing. Over time, the legal certainty provided by the PIAO Rules should compress the Indian lessor risk premium, translating into more competitive lease rentals for Indian carriers and gradually repositioning Indian aviation assets as a more investable credit.

    2026 is best understood as a period of recalibration for the Indian aviation market. Near-term data justifies more measured growth assumptions for the remainder of FY2026 and into FY2027. However, the structural drivers underpinning the sector, namely a deep passenger base, unparalleled orderbooks and an increasingly enforceable creditor framework, remain intact. Taken together, these developments suggest that Indian aviation is entering a more mature phase of development. Growth may be slower than recent expectations, but it is increasingly supported by a stronger financing ecosystem, more predictable creditor protections and a broader pool of capital. The next chapter will be defined by how these foundations are tested, adopted and ultimately validated by market participants.

  • Indian Aviation: Softer Growth, Stronger Foundations (Pt. 1)

    Team Perspective

    Sabrina Ng, Senior Valuations Analyst, Cirium Ascend Consultancy

    India is widely expected to be one of the world’s fastest-growing aviation markets. Strong demographic fundamentals and relatively low levels of air travel penetration continue to support a favourable long-term outlook. The 2025 Cirium Fleet Forecast projected that India’s ASK would grow at around 10% per annum in the next 10 years. Near-term data, however, suggests that the long-term growth may be less linear than previously expected, as airlines work through a combination of operational, financial and geopolitical challenges.

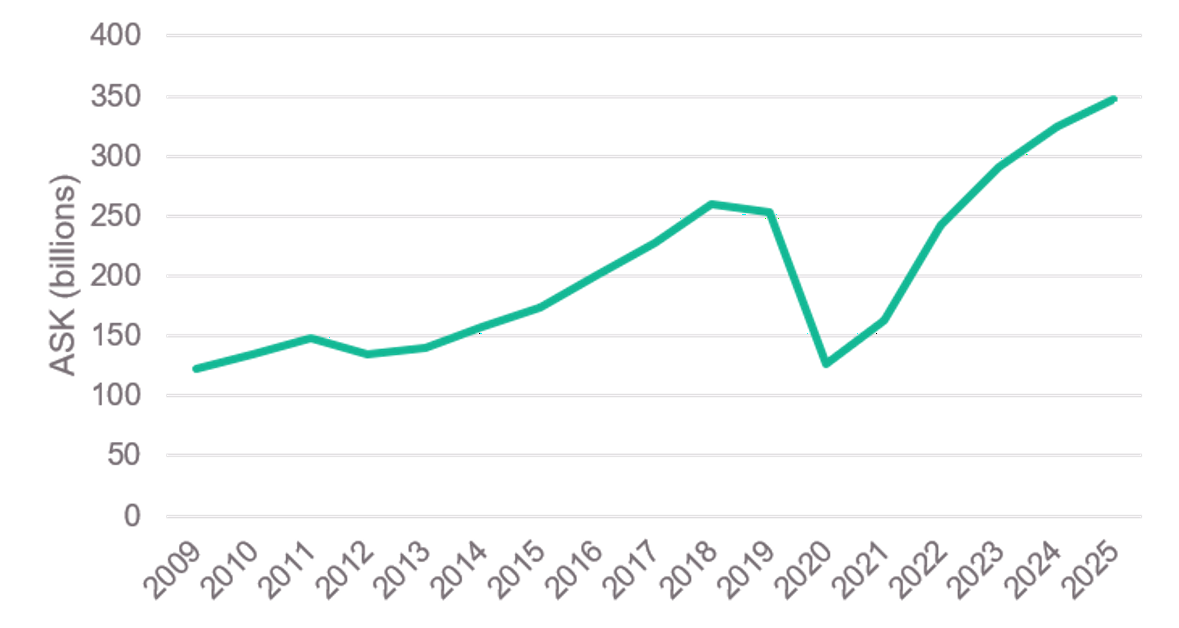
    Cirium Tracked Utilisation data suggests that there has been a considerable slowdown in growth since 2024, after compound growth of 10% per annum from 2009 to 2019, and a rapid post-Covid recovery. After growing by a modest 5.8% in 2025, ASK capacity from India moved into contraction, declining by 1.6% in H1 2026. At the airline level, IndiGo’s ASK growth slowed from 13.8% in 2025 to 3.3% YoY in H1 2026, while Air India Group experienced a more pronounced reversal, with its ASK swinging from 30.3% growth to a 16.2% contraction over the same period.

    Chart 1: Indian airlines ASKs, 2009–2025

    Source: Cirium core, Tracked Utilisation data filed on 22-July-2026 and DGCA traffic data

    Multiple factors are converging at once which drives the contraction. Persistent Pratt & Whitney GTF groundings continue to constrain IndiGo’s narrowbody utilisation, while widebody delivery delays and the phased integration of Vistara have limited how quickly Air India can expand its market share. Layered on top are tighter DGCA flight-duty rules that have raised crew requirements, elevated fuel prices, and extended routings following the closure of Iranian and Pakistani airspace amid the Iran conflict. The June 2025 Boeing 787 accident has added a further operational drag on Air India specifically, and newer entrants such as Akasa Air is also intensifying the market competition.

    Unlike several emerging aviation markets where state support can absorb periods of weak profitability, Indian airlines remain largely exposed to commercial market forces, and these operational disruptions have quickly translated into financial pressures. IndiGo posted a net loss of around US$250 million in FY2026 ending 31 March 2026, despite remaining operationally profitable when excluding the impact of sharp rupee depreciation. Akasa Air has yet to turn an annual profit, while Air India Group reported a loss of approximately US$2.8 billion for the same period. The Tata Group has since shifted Air India’s focus to prioritise loss reduction over expansion, with plans to defer aircraft deliveries, cut flights and delay network growth. The airline is reportedly in discussion with Airbus and Boeing to slow the delivery of up to 500 aircraft on order.

    Against this backdrop, effective yield management has become increasingly important as the airlines seek to preserve or improve profitability. According to Cirium data, revenue per RPK for Indian airlines on long-haul routes, particularly to North America, have failed to keep pace with rising operating costs and longer flight routings, and maintained at similar level compared to 2024 and 2025. By contrast, domestic yields have proven more resilient, rising by around one-third since 2024 despite intensifying competition.

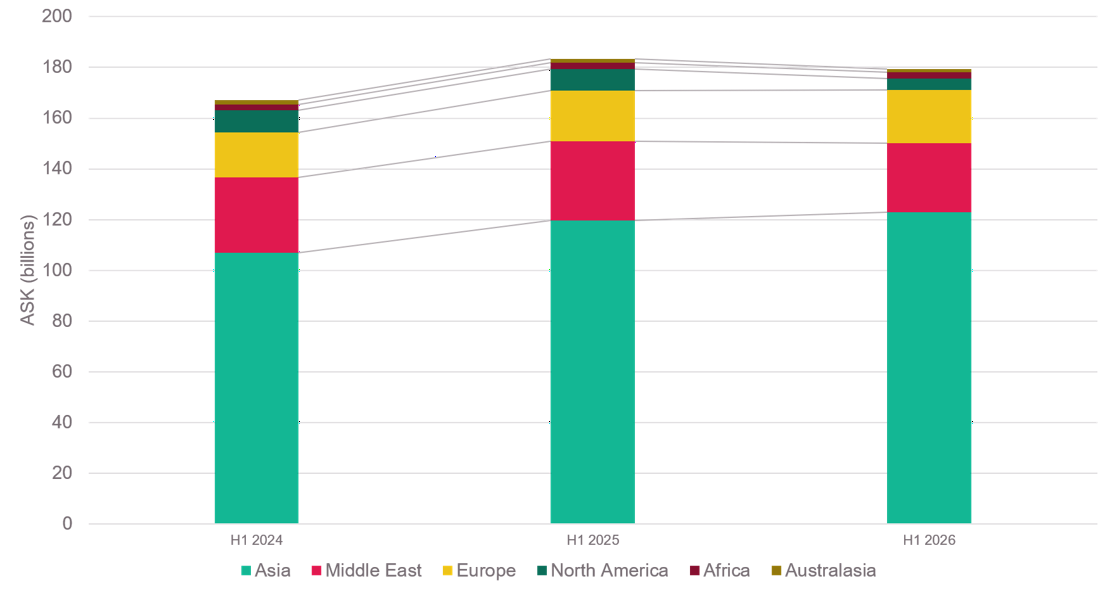
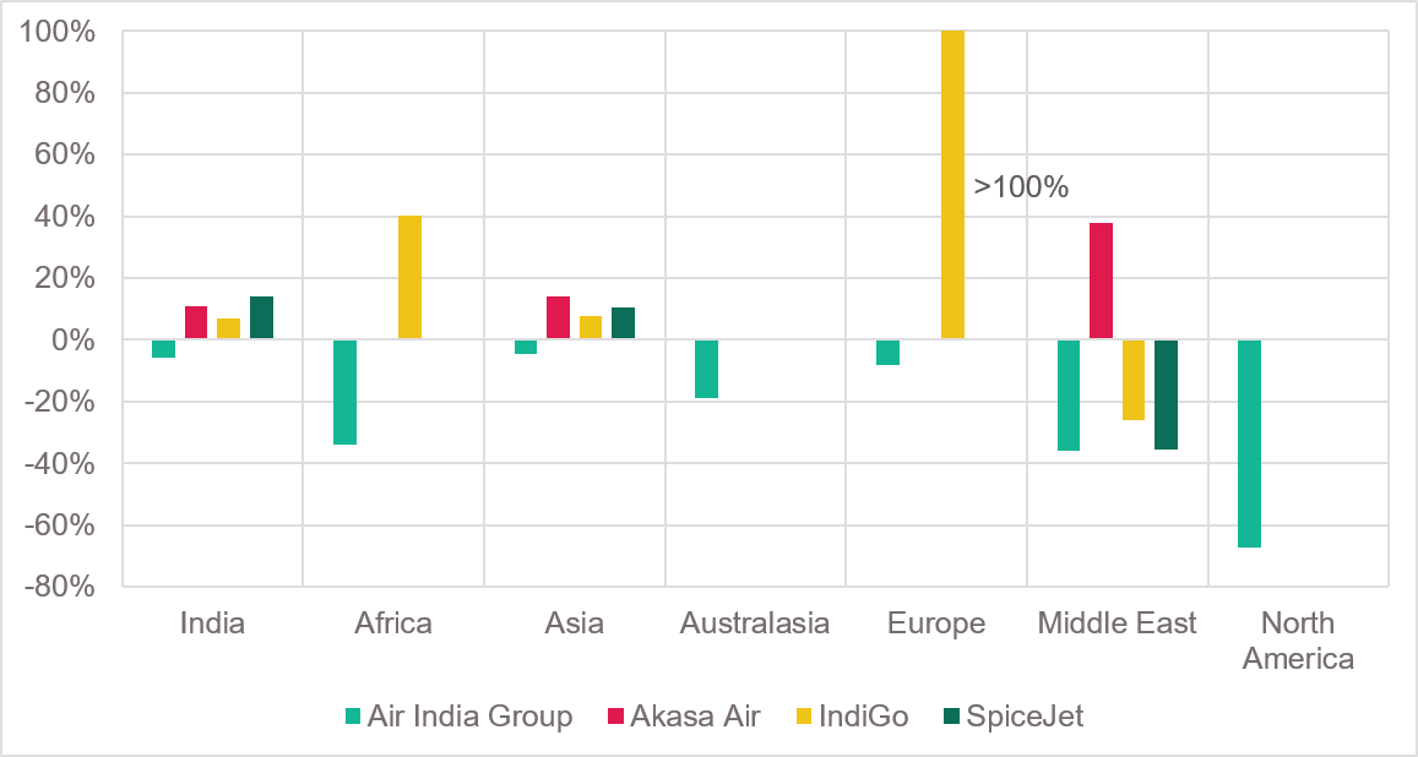
    Consequently, Indian carriers are realigning their networks toward routes that optimise utilisation and margins, particularly for Air India given its widebody exposure. According to Cirium’s Tracked Utilisation and Schedule data, India’s capacity to North America has contracted sharply through H1 2026, and is set to decline further in Q3 2026, as extended routings and elevated fuel costs have undermined the economics of many non-stop services. Air India has accounted for much of this reduction.

    Chart 2: India-origin ASK distribution by destination region, in H1 2024-2026

    Source: Cirium core, Schedule data filed on 05-Jul-2026

    Europe, by contrast, has strengthened its position as India’s key long-haul market and is expected to continue growing in Q3 2026. Indian carriers retain a routing advantage through access to Russian airspace, while European hubs are increasingly serving as gateways to North America. Although elevated operating costs have also prompted IndiGo to return one of its damp-leased 787-9s following the suspension of Manchester and Copenhagen services, Air India has on the other hand redeployed a significant portion of its A350-900 capacity from the reduced North American operation to Europe.

    Short-haul international markets have proven more resilient. While capacity to the Middle East was reduced during the Iran conflict, demand from labour, VFR and religious traffic is supporting a recovery. Akasa Air gained share during the disruption, and overall capacity growth is also expected to resume across the market in Q3. Africa has also emerged as a bright spot on the back of strengthening trade and diaspora links. Alongside IndiGo’s increased deployment to the region in H1 2026, Air India is shifting its A320neo capacity from the Middle East competition to Africa.

    Domestically, capacity has largely been maintained in line with resilient demand and yields. Notably, Akasa Air and SpiceJet are gaining market share at the expense of Air India, by leveraging the lower operating costs and greater flexibility of narrowbody aircraft on domestic routes.

    Chart 3: Percentage change in ASK by destination region of major Indian airlines (H1 2025 vs. H1 2026)

    Source: Cirium core, Schedule data filed on 20-Jul-2026

    India’s aviation market is undergoing a period of recalibration as illustrated above. While growth has moderated and airlines are reassessing fleet and network expansion plans in favour of stronger financial performance, the longer-term outlook remains compelling. Equally important, the framework supporting future fleet growth is evolving rapidly. New aircraft financing channels, including GIFT City and JOLCOs, alongside Cape Town reforms, are strengthening the market’s ability to fund the next phase of expansion. These developments will be discussed in Part Two.

    Read Part Two on how the rapid evolution of the financial and institutional framework supporting fleet growth in the Indian aviation market.

  • 2026 commercial aircraft H1 deliveries close to 2018 peak

    Team Perspective

    Max Kingsley-Jones, Head of Advisory, Cirium Ascend Consultancy

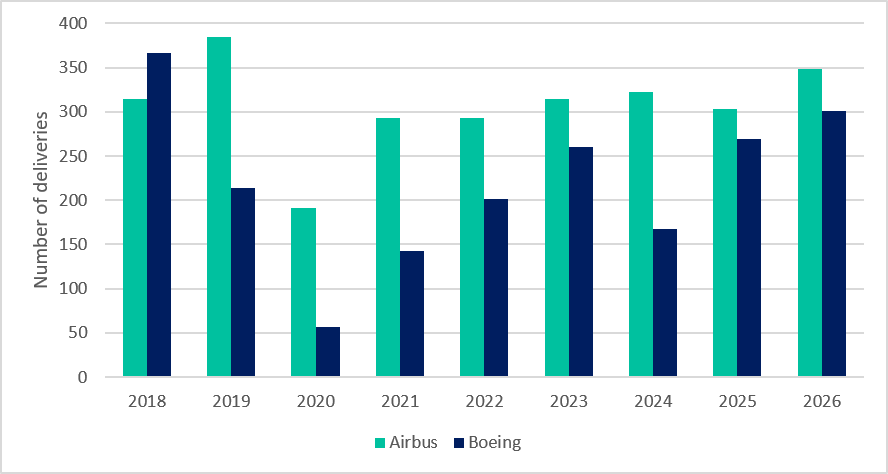
    Total commercial aircraft delivery volumes in the first half were the highest since the peak delivery year of 2018 with both Airbus and Boeing seeing sustained increases in shipment rates.

    Cirium data shows that the two OEMs shipped a total of 649 commercial passenger and freighter aircraft in H1 2026, which was 14% more than the prior half-year (572). This put their combined total just 5% below the industry’s H1 peak in 2018 of 681 aircraft. Airbus was the lead producer this year, taking a 54% share of the H1 total.

    Airbus actually set its highest first-half delivery total in 2019 (385 aircraft), when Boeing’s volumes were affected by the 737 Max grounding. Airbus’s 2026 total to June was 10% below its 2019 H1 peak.

    Airbus/Boeing H1 commercial aircraft deliveries: 2018-2026

    Source: Cirium Fleets Analyzer

    Cirium is currently projecting a total of around 1,510 Airbus and Boeing commercial aircraft deliveries in 2026, meaning that their six-month tally puts the two OEMs at around 43% of the expected full-year tally at the midway point. Airbus is currently projected to deliver around 865 aircraft, and Boeing around 645.

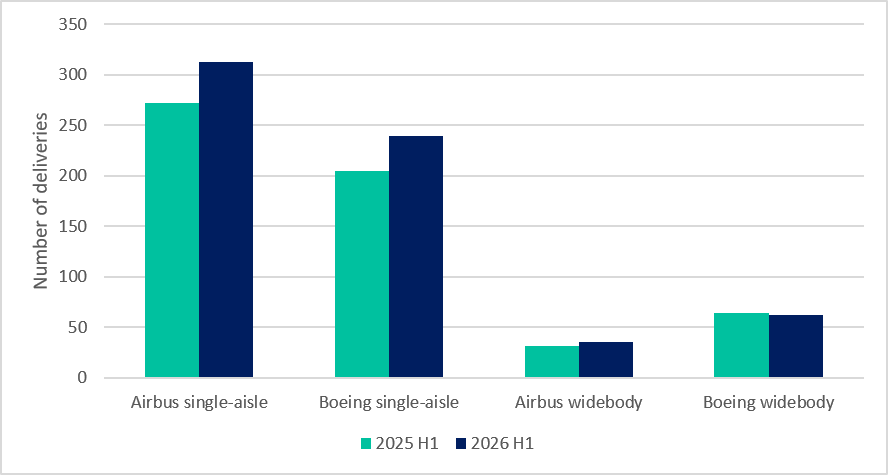
    In H1, there was solid growth in single-aisle deliveries across both the A320 family and 737 Max lines, while twin-aisle volumes were essentially flat.

    The Boeing 737-8 Max led the H1 2026 delivery rankings, with just shy of 200 shipments; The Airbus A321neo wasn’t far behind on 167. In the widebody sector, the Boeing 787-9 was top of the list with 35 deliveries, ahead of Airbus A350-900 on 20; Boeing’s freighter types, the 767-300F and 777-200LRF, accounted for 22 deliveries between them. Production of both these aircraft types is due to end next year due to new environmental legislation.

    Airbus/Boeing H1 commercial aircraft deliveries: 2025 vs 2026

    Source: Cirium Fleets Analyzer

    From a single-aisle powerplant perspective, it was CFM International that led on the A320neo family, ending the first half with a 57% share of deliveries. This followed a slow start for CFM, which trailed its programme rival Pratt & Whitney until the month of June, when it surged ahead.

    Cirium recorded a total of 269 A320neo family commercial deliveries in the first half. This equates to around 40% of Cirium Ascend Consultancy’s latest full-year projection for the Airbus single-aisle of around 660 deliveries. Based on the first-half run rate Airbus achieved, that currently looks achievable – barring any unforeseen disruptions from the supply chain or other dependencies.

  • Aviation and event-driven demand: The economics of World Cup tourism

    Yuanfei Zhao (Scott) Aviation Analyst
    Yuanfei Zhao (Scott) Aviation Analyst

    Team Perspective

    Yuanfei (Scott) Zhao, Principal Aviation Analyst, Cirium Ascend Consultancy

    Mega-sporting events have historically acted as powerful demand shocks capable of temporarily redrawing the global aviation map. However, as the industry prepares for the tri-nation tournament across North America, historical demand modelling is colliding with a severe supply-side constraint. To navigate this summer’s operational bottleneck, network planners must look beyond headline passenger volumes and understand the interplay between baseline traffic flows and highly elastic “shock markets.”

    More broadly, these dynamics sit within a wider “events economy” shaping global aviation demand. World Cups, religious gatherings such as the Hajj, and entertainment-led mega-events like global concert tours all generate short-duration but highly concentrated spikes in travel demand. While differing in purpose, they share a common structural feature: predictable timing paired with highly elastic, often long-haul demand surges that temporarily stress aviation capacity, pricing, and fleet allocation.

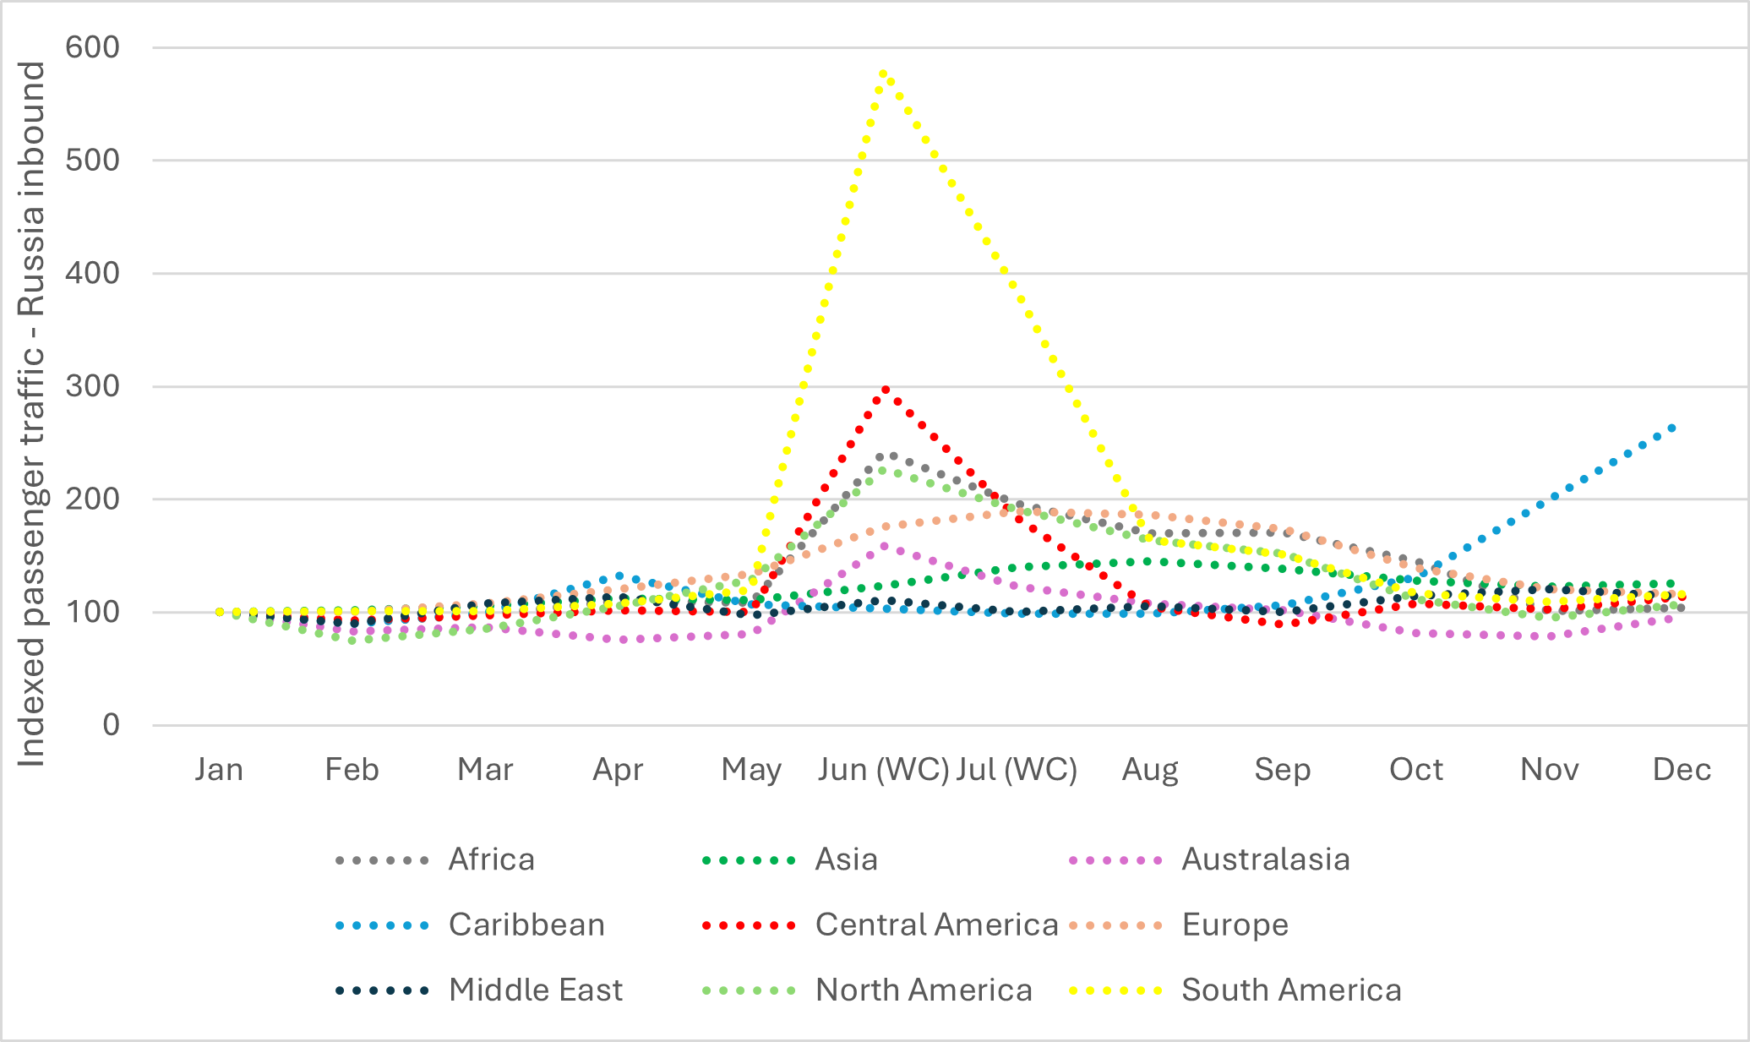
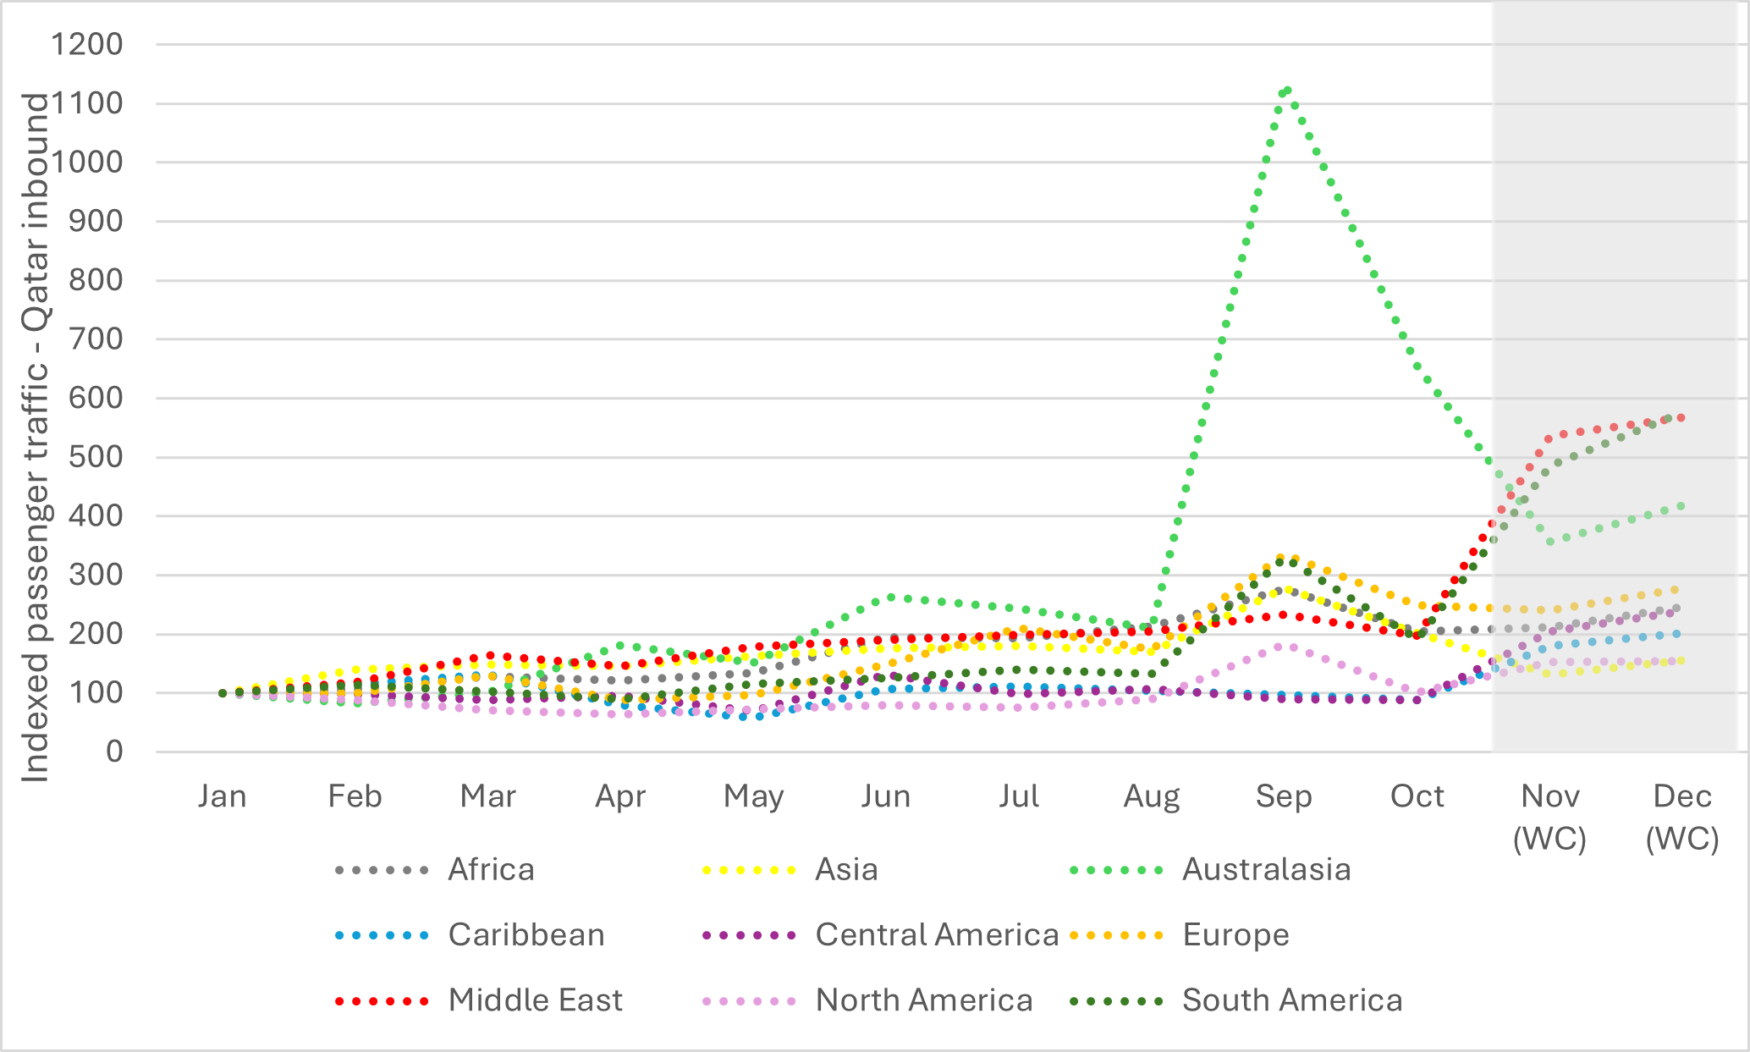
    Analysis of historical traffic data from the 2018 FIFA World Cup and 2022 FIFA World Cup reveals a critical commercial dichotomy between high-volume origin markets and highly volatile surge markets. Russia 2018 generated the classic Northern Hemisphere summer demand profile, while Qatar 2022 produced a more compressed and operationally complex year-end surge shaped by winter scheduling, Gulf hub connectivity, and post-COVID travel recovery.

    In terms of scale, Europe and Asia remain the dominant pillars of international aviation demand. During Russia 2018, Europe moved more than 110,000 monthly passengers into Russia between June and September, peaking at close to 120,000 in July, while Asia maintained volumes above 43,000 monthly passengers (31,000 in January) between July and September. Because these markets already operate at elevated baselines, percentage growth appeared comparatively moderate (+76% for Europe in June vs January). Yet in absolute terms, they formed the financial backbone of tournament traffic, filling most international capacity throughout the event cycle.

    Conversely, regions such as South America and Africa function as classic “shock markets.” While their absolute passenger volumes are smaller, their demand elasticity is exceptional. South American traffic surged by approximately +480% during June 2018 (~770) when indexed against January (~130) baseline levels, while Africa recorded growth of more than +140% (~650 Jan vs ~1,600 Jun). These markets demonstrate a strong willingness to absorb long-haul travel costs for football-driven tourism despite smaller underlying traffic volumes.

    When the tournament shifted to Qatar in 2022, the same dual structure remained, although the regional hierarchy changed materially. Unlike the 2018 FIFA World Cup, where Europe and Asia dominated inbound traffic, the Middle East emerged as the largest traffic generator, reflecting geographic proximity and the Gulf’s hub-centric aviation structure. Middle Eastern traffic increased by more than +460% into December (~1,600 Jan vs ~9,100 Dec), while Europe and Asia retained the second and third largest traffic baselines.

    However, the 2022 cycle was not purely World Cup-driven. The tournament coincided with the broader post-pandemic reopening phase, meaning part of the surge also reflected delayed travel recovery and pent-up demand normalisation. Notably, some long-haul markets, particularly Australasia, began accelerating as early as September 2022, suggesting that pent-up travel demand partially overlapped with World Cup-driven flows.

    Crucially, South American demand again proved largely agnostic to geography, expanding by nearly +480% despite the significantly longer travel distance to the Gulf region. Africa similarly recorded growth of roughly +145%, reinforcing the resilience of football-led long-haul demand.

    (Scaled index baseline: Jan 2018 = 100)

    Source: Cirium Core, FMTraffic

    Note: traffic volumes are indexed to January of each respective year and region (Jan = 100) to normalize baseline differences across regions and better isolate relative growth trajectories during each World Cup cycle

    (Scaled index baseline: Jan 2022 = 100)

    Source: Cirium Core, FMTraffic

    Note: traffic volumes are indexed to January of each respective year and region (Jan = 100) to normalize baseline differences across regions and better isolate relative growth trajectories during each World Cup cycle

    For the 2026 FIFA World Cup, these high-volume trunk routes from Europe and Asia, combined with elastic surges from South America and Africa, are expected to converge simultaneously on North America. Unlike the 2022 FIFA World Cup, however, North America lacks the same degree of short-haul regional concentration enabled by Gulf proximity and hub connectivity. Consequently, a greater share of tournament demand will rely on long-haul intercontinental capacity, intensifying pressure on fleet utilisation, fuel economics, and network deployment.

    This structural shift also arrives under materially different industry conditions than either 2018 or 2022. During Russia 2018, airlines still operated within a relatively stable pre-pandemic expansion cycle, while Qatar 2022 benefited from the rapid restoration of international capacity during the global reopening phase. By contrast, the 2026 tournament is emerging amid tighter fleet availability and a more fragile geopolitical operating environment.

    The ongoing geopolitical conflict involving Iran has already disrupted global energy and aviation networks, contributing to higher fuel costs, capacity rationalisation, and operational uncertainty. Airlines have spent much of the recent planning cycle reducing capacity growth and trimming marginal routes, while airspace restrictions across parts of the Middle East are forcing some long-haul services onto less efficient flight paths, increasing fuel burn and operational pressures.

    As a result, the challenge for airlines ahead of 2026 is shifting from volume maximisation to disciplined asset preservation. Carriers are likely to rely more heavily on dynamic pricing, fuel surcharges, and yield-based inventory management to protect margins while prioritising high-yield tournament traffic. Network planners may also need to consolidate frequencies and preserve deployment flexibility to concentrate constrained fleet and fuel resources on the highest-performing intercontinental corridors.

    These dynamics are not unique to football. Comparable patterns are visible across other global “event shocks.” For example, the Hajj pilgrimage has historically driven measurable aviation system impacts, including a roughly ~3% uplift in engine flight hours during peak periods, highlighting how religious demand waves can materially increase aircraft utilisation across concentrated time windows.

    Similarly, large-scale entertainment tours and destination concerts, such as Taylor Swift’s Tokyo shows (estimated ~$228m economic impact), generate short-duration international travel spikes that mirror the elasticity seen in sporting events, particularly in long-haul leisure markets. Even professional golf tournaments (PGA events) create more localised but still meaningful demand concentrations in premium hospitality and short-haul connectivity markets. Across these examples, the common denominator is not the event type itself, but the intensity, predictability, and spatial concentration of demand shocks.

    As a result, commercial success during the 2026 World Cup, and across the wider events calendar, will not necessarily belong to the airlines carrying the most passengers, but to those best able to balance demand elasticity, operational resilience, and network discipline. In an environment defined by constrained fleet supply, geopolitical friction, and structurally higher operating costs, the strategic advantage is shifting toward carriers capable of selectively deploying capacity through ACMI arrangements, dynamic network reallocation, and precision yield management during high-intensity demand windows.

  • Market trends and value review insights

    Eleni Maragkou, Valuations Analyst, Cirium Ascend Consultancy

    Between 2015 and 2025, the intermediate twin-engine helicopters have recorded consistent growth in fleet size, resulting in an increase in their share of the overall fleet. This reflects a sustained expansion of the segment alongside broader market growth. Historical fleet data is based on year-end positions, while forecast data reflects the 2025-2034 outlook.

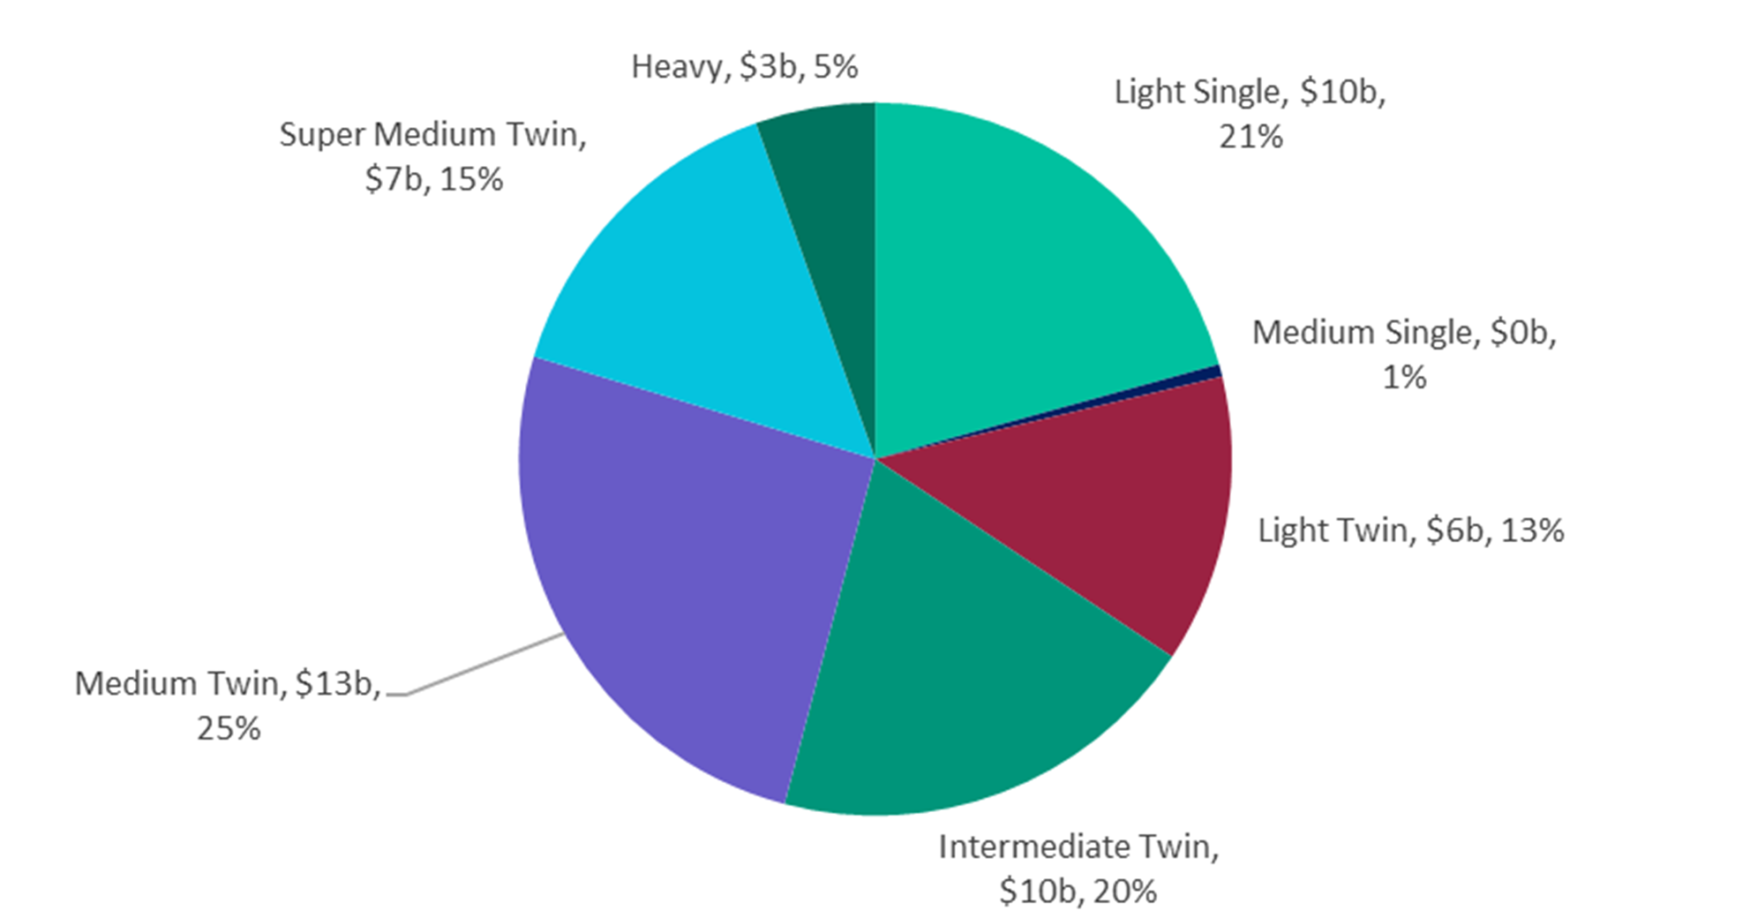
    The Cirium Helicopter Fleet Forecast (2025) indicates that intermediate twins accounted for approximately 10% of total deliveries over the past decade and are expected to increase to around 14% over the next ten years, representing a rise of approximately four percentage points. In value terms, the segment is forecast to represent approximately 20% of total market value, equivalent to around $10 billion between 2025 and 2034. This positions the intermediate twins as the third largest segment by value, supporting their growing importance within the overall market.  

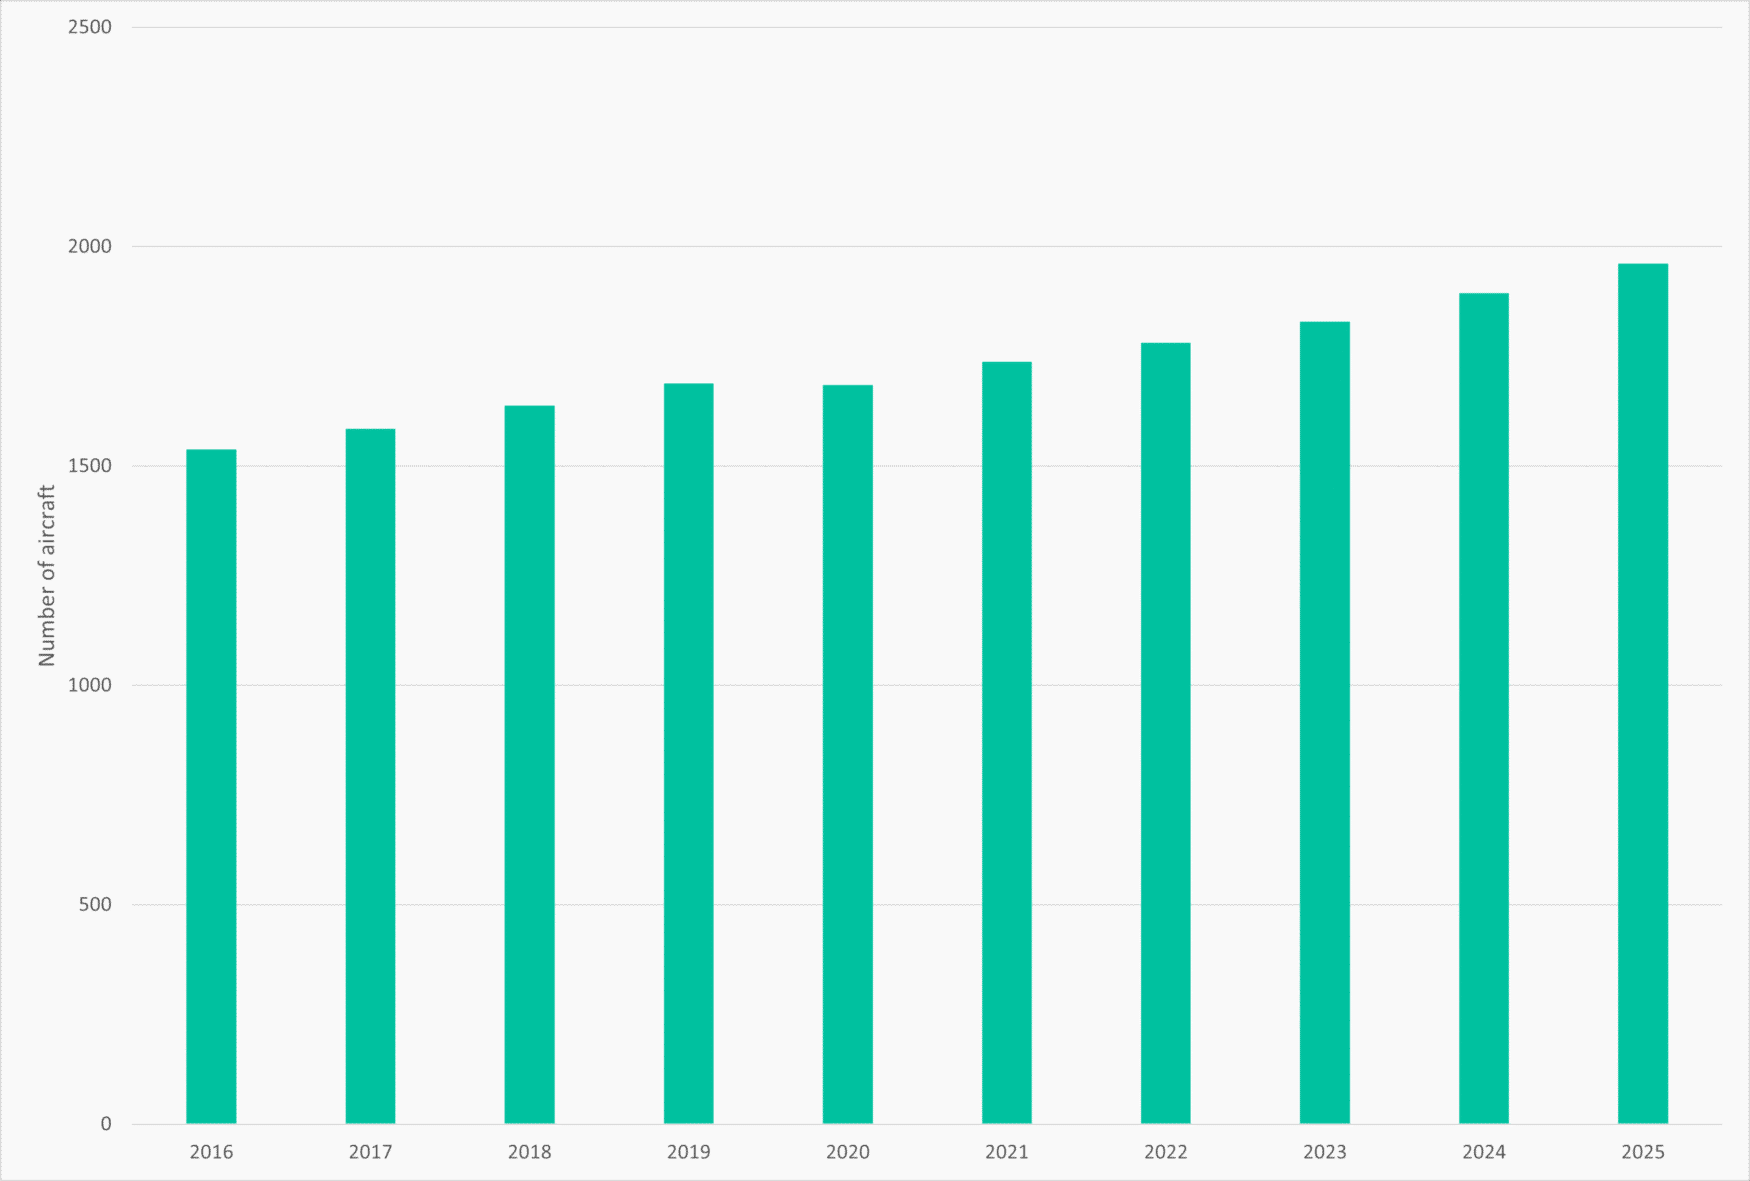
    Chart 1 shows that intermediate twins have experienced consistent growth in fleet size over the past ten years, broadly tracking their share within the fleet mix.

    Chart 1: Intermediate-twin in-service fleet trend – past 10 years

    Source: 2025 Helicopter Fleet Forecast

    The 2025 Helicopter Fleet Forecast highlights the forward outlook for the segment, with intermediate twins expected to account for approximately 20% of total market value over the 2025 to 2034 period. This reflects continued demand for aircraft that provide a balance between capability and cost, supporting their position as a core segment within future market activity.

    Chart 2: Fleet forecast of civil helicopter deliveries by value 2025-2034

    Source: 2025 Helicopter Fleet Forecast

    Fleet development data, further illustrate how these trends translate at an asset level. The Airbus Helicopters H145/EC145 fleet has grown from fewer than 100 aircraft in service in the early 2000s to approximately 900 aircraft by end of Q4 2025. Over the same period, storage levels have remained below 5% of the fleet, indicating that the majority of aircraft are actively deployed. This is relevant from a value perspective, as low storage levels typically indicate that supply is closely aligned with demand, supporting liquidity and reducing the risk of downward pressure on values. At the end of Q4 2025, 486 H145/EC145 aircraft were in service in the Emergency Medical Services (EMS) sector across 74 operators worldwide. This concentration within a single mission profile demonstrates the aircraft’s established role in core segment and supports consistent demand.  

    The Leonardo AW169 shows a consistent growth profile, with the fleet increasing from entry into service 2015, to approximately 200 aircraft by Q4 2025 with storage levels remaining minimal. This indicates that new deliveries are largely being absorbed into active operations. As of Q4 2025, 59 aircraft were deployed in EMS roles across 19 operators worldwide, showing that the type has also established a presence within key mission segment.

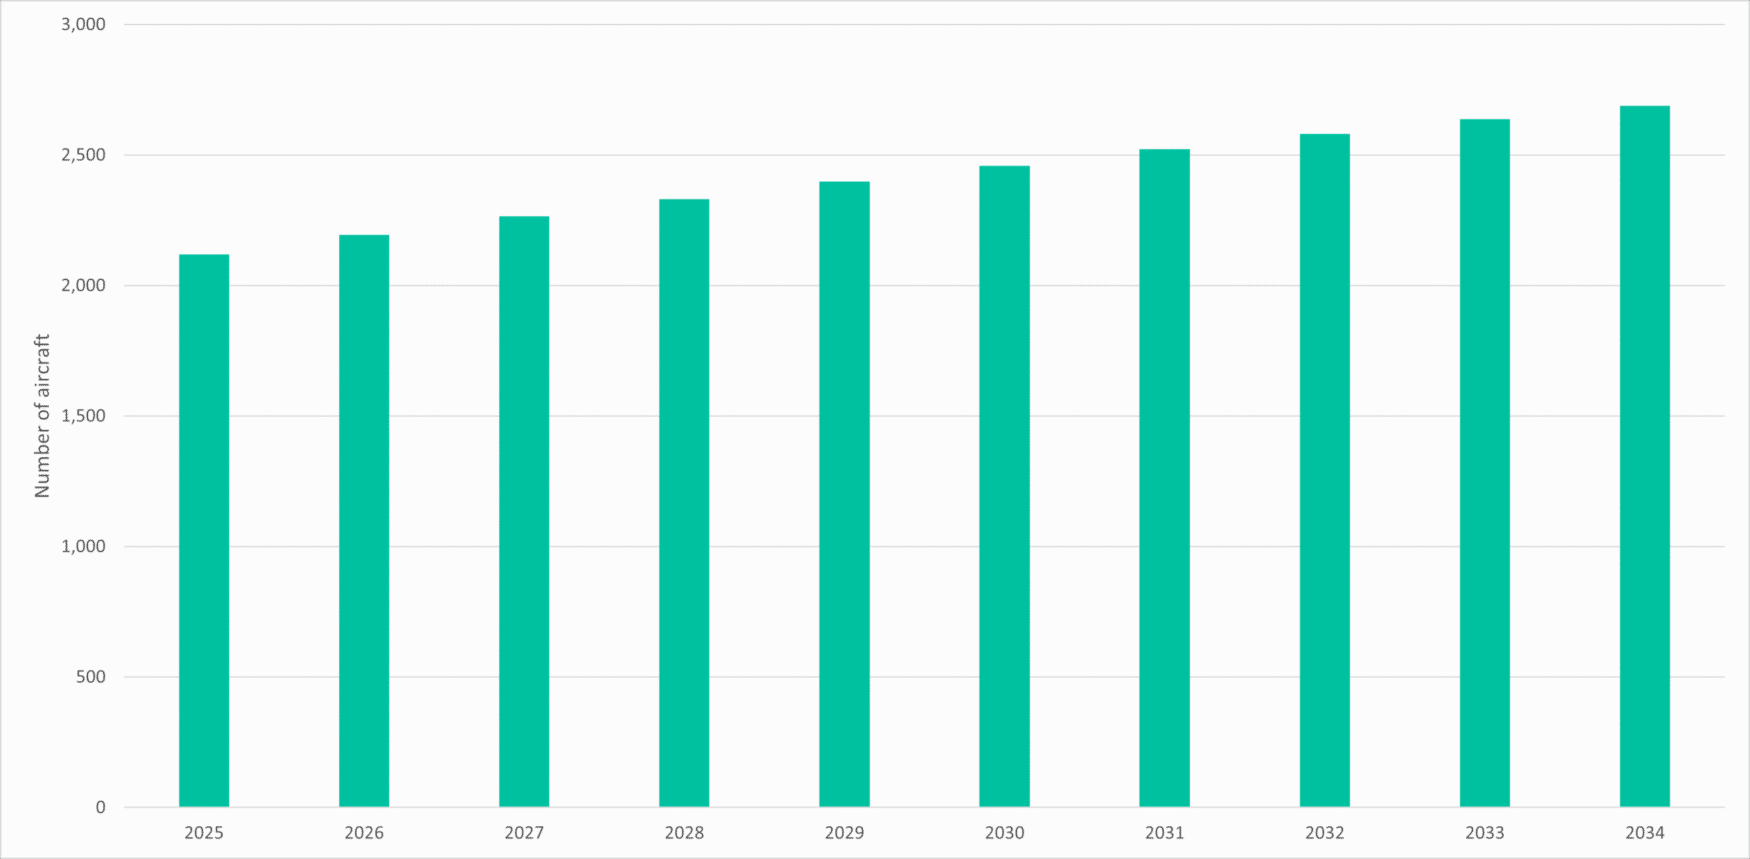
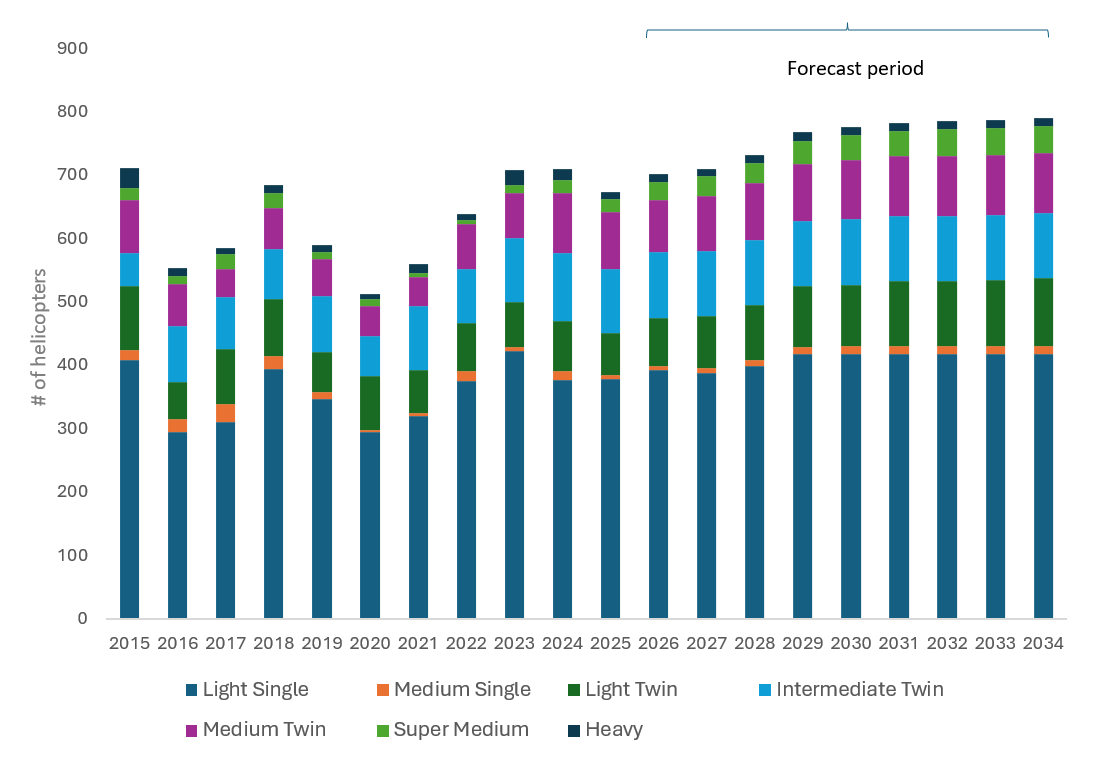
    Chart 3 shows that intermediate twin helicopters are expected to increase their share of total fleet over time. When considered alongside historical fleet development, this indicates that the segment’s growth is both established and expected to continue over the forecast period to 2034.  

    Chart 3: Forecast intermediate-twin helicopter fleet to 2034

    Source: 2025 Helicopter Fleet Forecast

    The expansion of intermediate twins over time reflects broader changes in how operators are selecting aircraft. In Europe in particular, intermediate twins have become increasingly prevalent in EMS operations following regulatory changes which amongst other things include the requirement of improved safety performance in the event of an engine failure. This has contributed to a shift from smaller platforms towards aircraft capable of meeting these requirements, supporting increased adoption of types such as the H145. As a result, replacements and upgrade activity have seen types such as the AW109 and H135 moving into secondary markets, particularly outside Europe, where requirements and mission profiles differ.

    From a value perspective, fleet scale and utilisation across multiple operators are key indicators of market depth. The H145 benefits from a larger installed base established operator network, supporting consistent levels of market activity and stable storage trends. The AW169, has demonstrated consistent fleet growth since entry into service and increasing deployment across multiple mission profiles, including EMS (28%), law enforcement (24%) and corporate use (20%). This diversification supports demand across different end markets and contributes to overall market stability.

    Leasing activity provides additional support to the segment. The 2025 Helicopter Fleet Forecast indicates that leasing activity has increasingly expanded into intermediate twin helicopters, with the segment accounting for approximately 15% of lessor focus in recent years. This reflects growing confidence in the long-term demand profile.  The missions supported by the H145/EC145 and AW169 are often long-term contracts, backed by governments providing favourable credit. Such structures provide predictable revenue streams and contribute to lower perceived asset risk, supporting value retention.

    Looking ahead, the increase in market share over the past decade suggests that intermediate twins are becoming an important part of the fleet mix. This is supported by their ability to operate across a range of missions while maintaining a cost profile that is lower than larger aircraft categories. At the same time, continued fleet growth, low storage levels and expanding leasing activity indicate that demand remains aligned with supply.

    Overall, the intermediate twin helicopter segment is supported by sustained fleet growth, increasing the share of total market value and continued expansion across core mission profiles. Aircraft such as the Leonardo AW169 and Airbus Helicopters H145/EC145 illustrate how fleet development, regulatory influences and market depth contribute to value behaviour. As the segment continues to mature, its increasing share of total market value combined with consistent fleet expansion and low storage levels, suggest that intermediate twins are likely to remain a core focus for both operators and lessors, supporting continued liquidity and stable value performance over the medium term.

  • How higher jet fuel prices are reshaping airline capacity plans

    Cirium Ascend Consultancy is trusted by clients across the aviation industry to provide accurate, timely, and insightful aircraft appraisals. The team provides the valuations and analysis the industry relies on to understand the market outlook, evaluate risks and identify opportunities.

    Discover the team’s industry reports & market commentaries. Read their latest expert analysis, viewpoints and updates on Thought Cloud.

    Richard Evans airline consultant
    Richard Evans airline consultant
    Richard Evans – Senior Aviation Analyst, Cirium

    Team Perspective

    Richard Evans, Senior Consultant, Cirium Ascend Consultancy

    Three weeks ago, Cirium’s forward schedule data for April 2026 showed a 3.4% year-on-year growth in ASKs, compared to 5.4% immediately before the conflict started. For May 2026, planned capacity had fallen marginally, from 6.6% to 6.3%.

    Since then, airlines have continued to adjust their near-term schedules, as a direct result of airspace and airport disruption in the Middle East, as well as due to the cost impact of a doubling in jet fuel prices. The latest schedule data now shows that April 2026 ASKs are down by 2.0% year-on-year, in-line with the March 2026 actual flown capacity. May 2026 capacity has now been cut by around three percentage points, to stand at 3.4% growth over May 2025. 

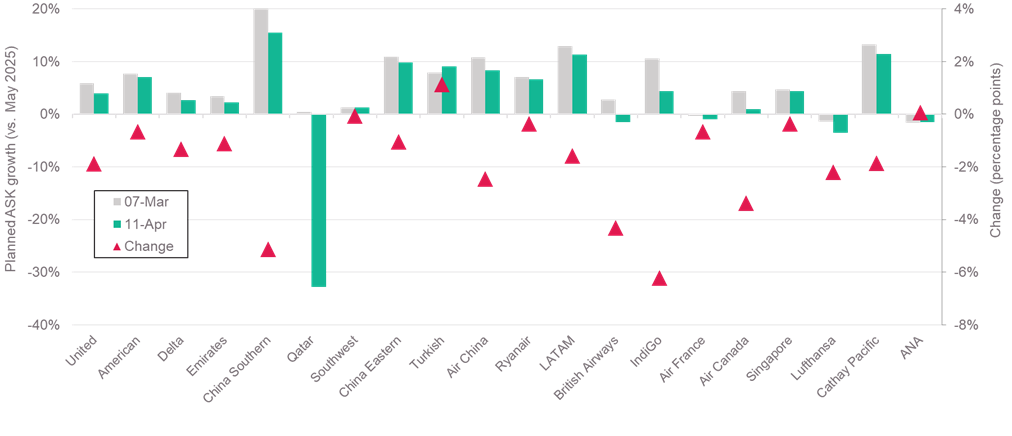
    The chart below shows the latest May 2026 capacity plans of the 20 largest airlines, in terms of ASKs. With one exception, Turkish Airlines, all the airlines have cut their May schedule. Most have made reductions of 0-5 percentage points, consistent with the global change of 3%. There is a noticeable contrast between Qatar, with schedule now down 33% versus May 2025, and Emirates, who still plan a 2.4% year-on-year growth.

    All regions have seen schedule cuts, with major airlines in North America, Europe and Asia Pacific reacting to a similar degree. The two purely short-haul carriers in this sample, Southwest and Ryanair appear to have been impacted less, making cuts of less than 1% at present.

    It appears extremely likely that more reductions are ahead. Delta guided to flat year-on-year capacity in Q2 2026, against its current plan of 2.7% growth and Ryanair hinted it might trim schedules by 5-10% if jet fuel prices remain at their current levels.

    Planned capacity for May 2026 – largest airlines

    Source: Cirium schedules data, Cirium Ascend Consultancy analysis

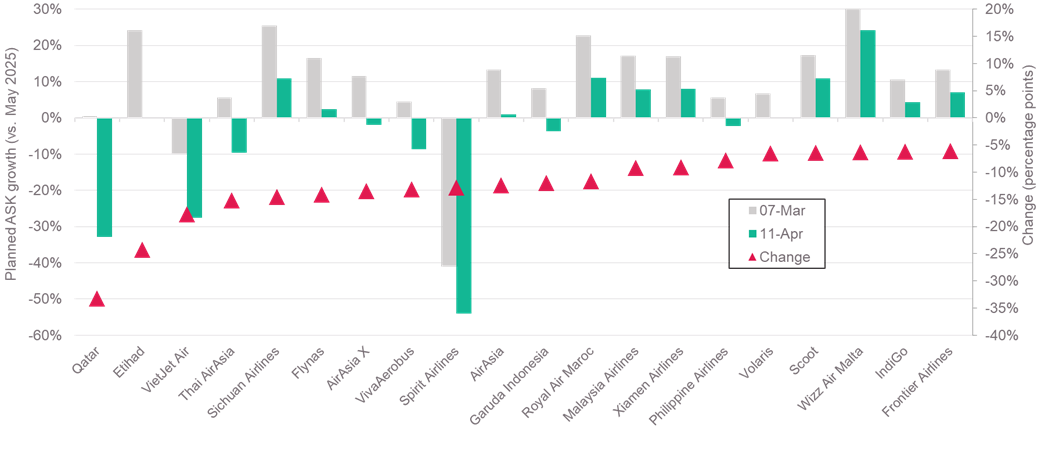
    Turning to the 100 largest carriers, those with the biggest reductions in planned capacity unsurprisingly have several from the Middle East at the top of the list. However, there are airlines from a wide variety of countries represented in the data. Southeast Asian carriers appear to have been greatly impacted, consistent with media reports of fuel supply shortages in Vietnam and Philippines. Airlines from Malaysia and Indonesia have also cut planned schedules by around 10-15%. Some smaller Chinese airlines are also included, such as Sichuan Airlines and Xiamen Airlines.

    Some of these airlines were planning on very large capacity expansions, and their latest schedules still imply year-on-year growth of 5% or more. Nevertheless, the list appears to show particular impact for  some of the LCC carriers in Asia and the Americas.

    Planned capacity for May 2026 – biggest schedule reductions

    Source: Cirium schedules data, Cirium Ascend Consultancy analysis, Top 100 airlines by Jan 2025 ASKs

    With the Iran conflict not fully resolved, it is clear that 2026 will experience a significant slowing of traffic and capacity, compared to Cirium Ascend Consultancy’s initial prediction of 4-6% growth over 2025. The impact will clearly be both deeper and more prolonged the longer the conflict continues and the longer jet fuel prices remain at their current levels, with second-order economic effects and risks increasing.

    We have constructed some initial scenarios to estimate the global impact on the aviation market, which have been shared in more detail to our Commercial Aviation Monitor clients, and at industry events. These are based on modelling month-by-month capacity profiles for each airline domicile region, in the same way we considered the impact and recovery from Covid-19. The scenarios produce a range of outcomes, with 2026 global capacity change ranging from a decline of 2-3% to growth of 1-3%.

    The more severe scenarios will require airlines to take additional action. Older, less fuel-efficient aircraft are the most likely to see utilisation cuts or parking. Airlines will seek to preserve cash in such circumstances, implying maintenance deferrals and fewer lease extensions. New aircraft deliveries appear less vulnerable, given the obvious fuel savings they deliver, but airframers themselves may face additional supply chain issues. Cirium will cover all these issues and more over the coming months.

  • The helicopter market: from volatility to maturing resilience

    Cirium Ascend Consultancy is trusted by clients across the aviation industry to provide accurate, timely, and insightful aircraft appraisals. The team provides the valuations and analysis the industry relies on to understand the market outlook, evaluate risks and identify opportunities.

    Discover the team’s industry reports & market commentaries. Read their latest expert analysis, viewpoints and updates on Thought Cloud.

    Team Perspective

    Sara Dhariwal, Lead Appraiser – Helicopter & AAM Markets , Cirium Ascend Consultancy

    Last week’s Cirium Ascend Consultancy helicopter market webinar examined the key forces shaping today’s rotorcraft market, from fleet growth and replacement cycles to civil‑military production dynamics, oil pricing and delivery trends.

    After more than a decade of disruption, the market is showing clear signs of maturity. Long asset lives, disciplined deliveries and an ageing global fleet are supporting stability today, while also underpinning future replacement demand.

    Reflecting this shift, Sarah Johnston, In‑House Counsel at SMFL Helicopters, noted that increased stability and a growing number of market participants represent “a very positive development” for the sector. Gabriella Oliveira del Mastro, Fleet Director at PHI, similarly observed that greater stability reflects a more deliberate and mature market approach.

    Steady fleet growth, shaped by longevity

    Over the past decade, the global civil helicopter fleet has grown at an average rate of around 1.5% per year. Growth slowed briefly in 2020 as the pandemic disrupted deliveries, but has since recovered, with expansion closer to 2% annually in recent years. By the end of 2025, the global fleet reached approximately 24,500 helicopters, representing a net increase of just over 3,200 aircraft.

    Fleet growth has been supported less by elevated deliveries and more by persistently low exit rates, with retirements and total losses averaging just over 1% per year. Longevity remains a defining feature of the market, with around 90% of helicopters delivered over the past 30 years still in operation and the average retirement age approaching 40 years. While this durability underpins asset values, it has also resulted in a steadily ageing global fleet.

    Replacement demand is building — but slowly

    Looking ahead, replacement rather than fleet expansion is expected to be the primary driver of helicopter demand. Cirium estimates that just over 4,000 helicopters could require replacement over the next decade — equivalent to around 70% of the current global fleet. While elevated asset longevity and OEM production constraints have delayed replacement activity, they have also helped restrict supply and support asset values.

    As the market evolves, a more mature secondary ecosystem is beginning to form. del Mastro noted that the helicopter sector is starting to adopt attributes long established in fixed‑wing aviation, including structured part‑out activity and lifecycle management. Echoing this, Johnston highlighted the need for stronger and more formalised secondary‑market support, underscoring the role this will play in enhancing capital efficiency and long‑term value preservation.

    Civil and military demand: competition for capacity?

    A recurring question is whether rising military demand is constraining deliveries into the civil helicopter market. Civil and military variants often share production lines and supply chains, making this a valid concern given the current geopolitical environment.

    Historical data suggests OEMs have generally balanced production across both segments over the long term. However, the ongoing deferral of civil replacement into the latter part of this decade risks overlapping with the next anticipated military renewal cycle in the early‑to‑mid 2030s. Should this occur, pressure on production capacity and delivery lead times could intensify.

    In parallel, sustained increases in military utilisation could place additional strain on shared supply chains, particularly in parts availability and MRO capacity, with potential knock‑on effects for both civil and military operators.

    Oil prices: short‑term volatility versus structural impact

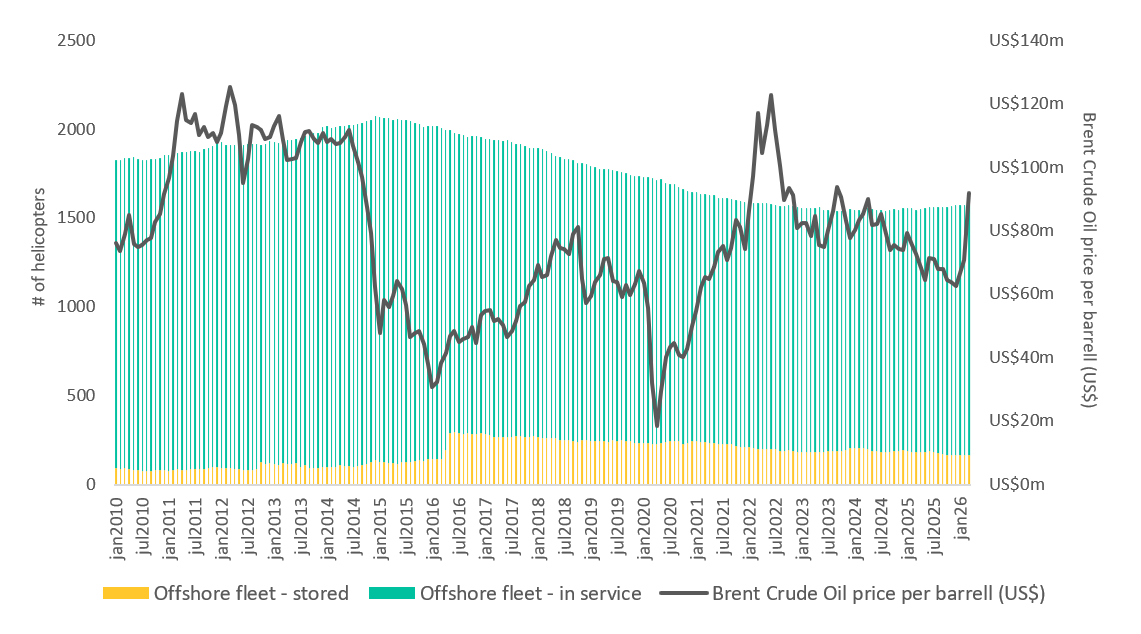
    Geopolitical conflict and associated oil‑price volatility have renewed concerns about a potential downturn similar to that experienced in 2014. However, there is currently little evidence to suggest that short‑term price movements alone will materially alter helicopter fleet dynamics.

    Chart 1: Offshore fleet evolution and crude oil pricing

    Source: Cirium Fleets Analyzer / U.S Energy Information Administration EIA

    The previous downturn was driven not by volatility, but by a prolonged period of sustained high oil prices, which encouraged aggressive fleet expansion based on assumptions of long‑term demand growth. When prices subsequently fell and remained depressed, the market was left with significant oversupply and prolonged pressure on utilisation and values. By contrast, recent pricing appears to have settled at a more sustainable level, around US$80 per barrel, historically supportive of offshore helicopter operations and a more balanced supply‑demand environment.

    While broader macroeconomic risks persist — including inflationary pressures and recessionary concerns that could weigh on values and investment appetite — the key takeaway for the helicopter industry is clear: sustained structural trends matter far more than short‑term volatility.

    A maturing helicopter leasing market

    The helicopter leasing sector has evolved significantly since its emergence around 15 years ago. Recent consolidation has concentrated a sizeable portion of the global leased fleet among a small number of major international lessors, contributing to greater stability and a more disciplined growth profile.

    Growth among established lessors has increasingly been driven by sale‑and‑leaseback transactions, rather than speculative order books, improving alignment with operator demand and reducing risk exposure. While leasing penetration remains lower than in commercial fixed‑wing aviation, there is clear scope for further expansion across multiple mission profiles, including EMS, utility, offshore energy and search‑and‑rescue operations.

    Johnston described the sector as “highly dynamic and competitive”, noting that “there remains considerable headroom for additional leasing activity, both globally and across different market segments”.

    del Mastro echoed this view, adding that increased competition is a positive development: “Coming from the fixed‑wing sector, where leasing choice is well established, I expect similar trends to continue developing in the rotorcraft market.”

    Deliveries and the outlook for the next decade

    Following delivery volumes of around 700 aircraft per year in 2023 and 2024, 2025 saw a modest decline, in line with expectations. Over the next decade, Cirium anticipates a gradual recovery, with average fleet growth of approximately 1.4% per year, equating to around 7,500 deliveries. Importantly for investors, more than half of these aircraft are expected to serve replacement demand, representing an addressable market of roughly US$50 billion on a full‑life value basis.

    Chart 2: Cirium Helicopter 10-year Fleet Delivery forecast 2025

    Source: Cirium 2025 Helicopter Fleet Forecast

    While extended lead times and ongoing supply‑chain constraints continue to limit near‑term deliveries, they have also reinforced supply discipline and supported asset values. From an operator and investor perspective, predictability and capital efficiency remain key priorities. del Mastro noted, “greater predictability on when aircraft can enter service is critical, alongside improved capital efficiency over the life of the aircraft and better access to competitive lease and debt financing”. She added that more predictable certification, STC processes and OEM production schedules would further enhance lifecycle optionality and returns.

    New technology: complementary rather than disruptive

    Emerging technologies — including autonomous helicopters, drones and eVTOL platforms — continue to attract attention. While progress is being made, their near‑term impact on the traditional helicopter market is expected to be complementary rather than disruptive.

    Initial applications are likely in cargo, logistics and unmanned operations, where certification and operational barriers are lower. More complex missions will take longer to materialise, particularly where energy density, safety and regulation remain limiting factors.

    A resilient market, well set up for gradual change

    The helicopter sector today is defined by stability and resilience rather than rapid expansion. Long asset lives, disciplined production, diversified missions and a more mature leasing ecosystem have reduced volatility and helped stabilise values.

    While supply‑chain constraints and geopolitical uncertainty remain, the overarching outlook is one of measured growth, delayed but unavoidable replacement demand, and gradual evolution rather than disruption. For operators, investors and OEMs alike, predictability, transparency and disciplined planning will be critical as we move into the next decade.

    Watch the webinar on-demand

    To access the presentation and watch Sara, Gabriela and Sarah’s full discussion, register to watch.

  • Middle East Conflict Impact on Global Airline Capacity

    Cirium Ascend Consultancy is trusted by clients across the aviation industry to provide accurate, timely, and insightful aircraft appraisals. The team provides the valuations and analysis the industry relies on to understand the market outlook, evaluate risks and identify opportunities.

    Discover the team’s industry reports & market commentaries. Read their latest expert analysis, viewpoints and updates on Thought Cloud.

    Richard Evans airline consultant
    Richard Evans airline consultant

    Team Perspective

    Richard Evans, Senior Consultant, Cirium Ascend Consultancy

    While it is too early to predict the length or macro-level effect on the global economy of the conflict in the Middle East, we can measure the impact to-date on airline capacity, via Cirium’s Tracked Utilisation data.

    At the start of 2026, Cirium Ascend Consultancy’s view was that global traffic (RPKs) and capacity (ASKs) would grow in the range of 4-6% versus 2025. This was broadly in line with the visible forward schedule, and also similar to IATA’s December 2025 Outlook, which predicted 4.9% global RPK growth.

    IATA reported January 2026 traffic was up 3.8% versus 2025, on capacity up 3.5%. It has not yet reported February figures, but Cirium data shows that actual ASKs flown grew by 5.3% last month.

    For March 2026, Cirium’s forward schedule, at the start of the month, indicated the airlines would expand capacity by 5.6%. This figure had already declined slightly compared to the advance March schedule at the start of the year, which showed growth of 6.8%.

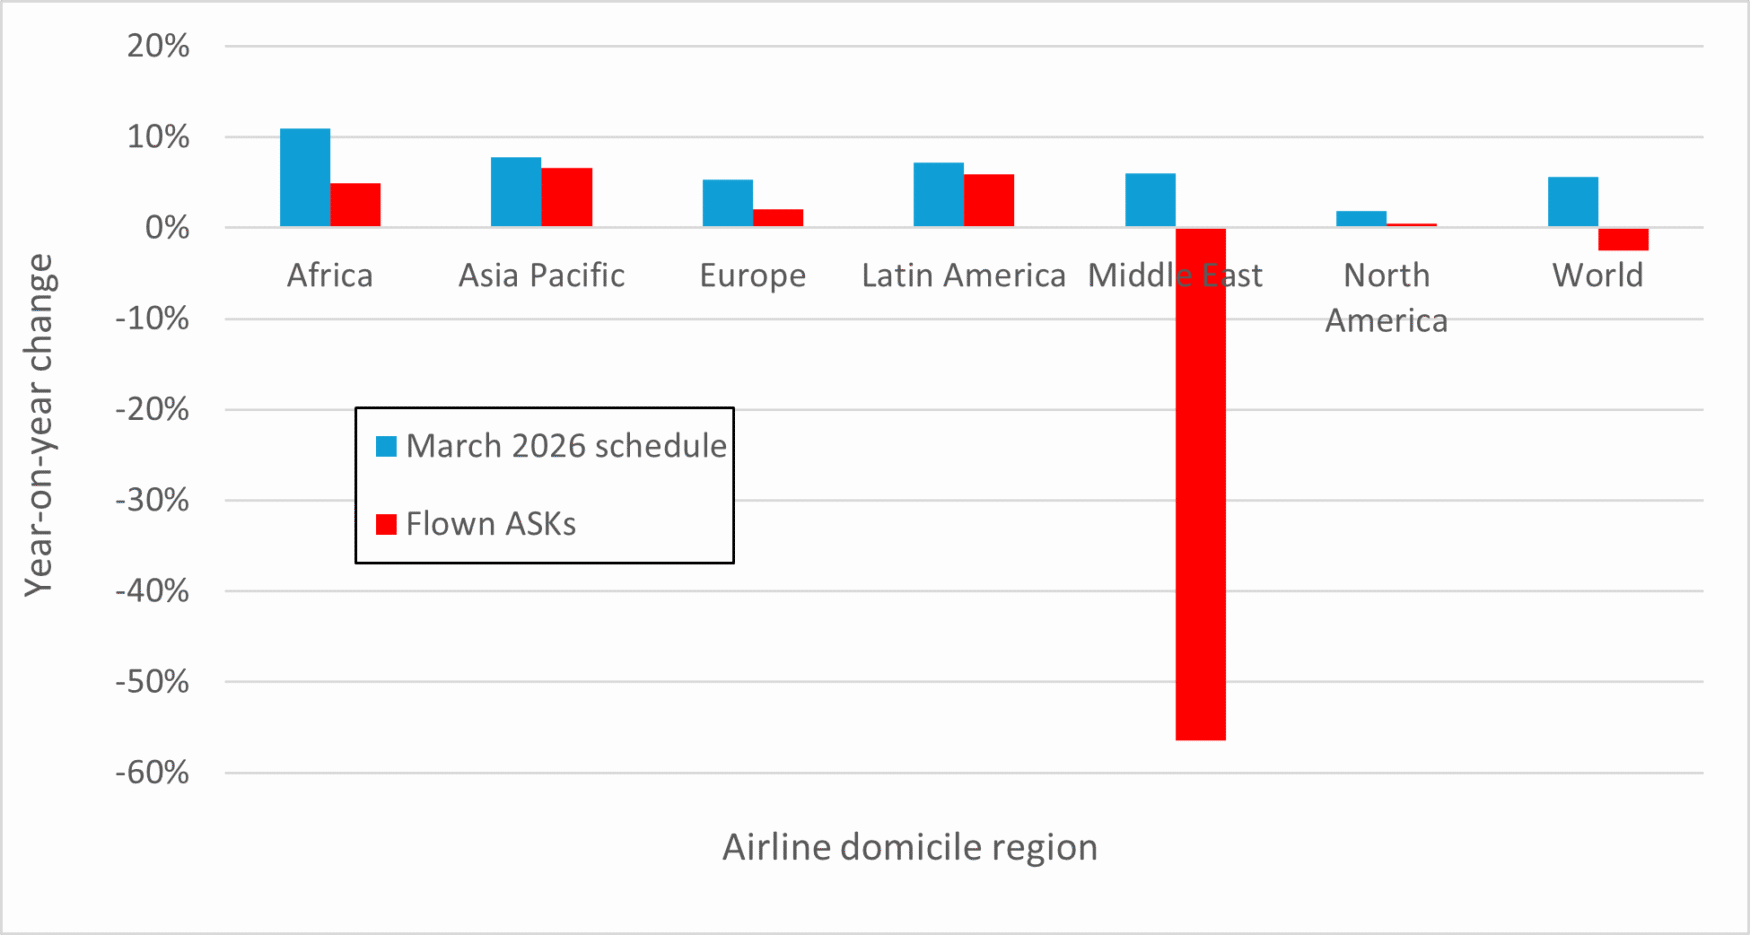
    Our tracked data, up to and including 22 March 2026, shows that the number of passenger flights grew by just 1.2% over the same period in 2025. Unsurprisingly, the major impact was on Middle East domiciled airlines, which have experienced a 52% decline in flights year-on-year. The region made up just 4% of tracked flights in March 2025, but it has a far larger impact in terms of ASKs, as the airlines tend to fly larger aircraft and serve longer stage lengths than in other regions. It amounts to 10% of global ASKs, based on March 2025 data.

    The chart below shows March 2026 flown ASKs, by airline domicile region, compared to March 2025. The 56.5% decline in Middle East airline capacity contributes to a global contraction of 2.5% in the first 22 days of the conflict.

    Actual capacity flown 1-22 March 2026, versus planned schedule

    Other regions are also impacted, but to a lesser degree, with many airlines cancelling flights to the Gulf states, Saudi Arabia and Israel. Comparing the forward schedule for March with the actual ASK flown provides an indication of the impact. African carriers have seen a roughly 5-6 percentage point hit, with European airlines the second most affected, with flown ASKs up 2%, versus a planned schedule increase of 5.3%. Asian carriers have experienced just a one percent impact, but this obviously varies considerably, with Indian sub-continent airlines most affected. North American airlines have seen a similar effect, with United Airlines noting that suspending its services to Riyadh and Dubai knock about 1% from its ASKs.

    Looking further ahead, several airlines have announced that service suspensions to the Middle East will continue into April and May. However, the forward schedule at the time of writing has not changed dramatically. April 2026 currently shows 3.4% year-on-year growth in ASKs, compared to 5.4% immediately before the conflict started. May 2026 has fallen marginally, from 6.6% to 6.3%.

    Even if passenger load-factors remain high, with strong demand in other markets stated by several airlines, the conflict has led to an eight percentage-point hit to airline capacity in March. This is before we see any measurable impact from higher jet fuel prices on demand. This level of demand/capacity disruption, if it continues for any length of time, does imply a significant effect on aircraft utilisation rates and fleet plans.    

  • What’s at Stake for Aviation in the Middle East?

    Cirium Ascend Consultancy is trusted by clients across the aviation industry to provide accurate, timely, and insightful aircraft appraisals. The team provides the valuations and analysis the industry relies on to understand the market outlook, evaluate risks and identify opportunities.

    Discover the team’s industry reports & market commentaries. Read their latest expert analysis, viewpoints and updates on Thought Cloud.

    Team Perspective

    George Dimitroff, Head of Valuations, Cirium Ascend Consultancy

    As the world tries to grasp the consequences of the escalating conflict in Iran and the wider Middle East, the following sets out Cirium Ascend Consultancy’s early thoughts.

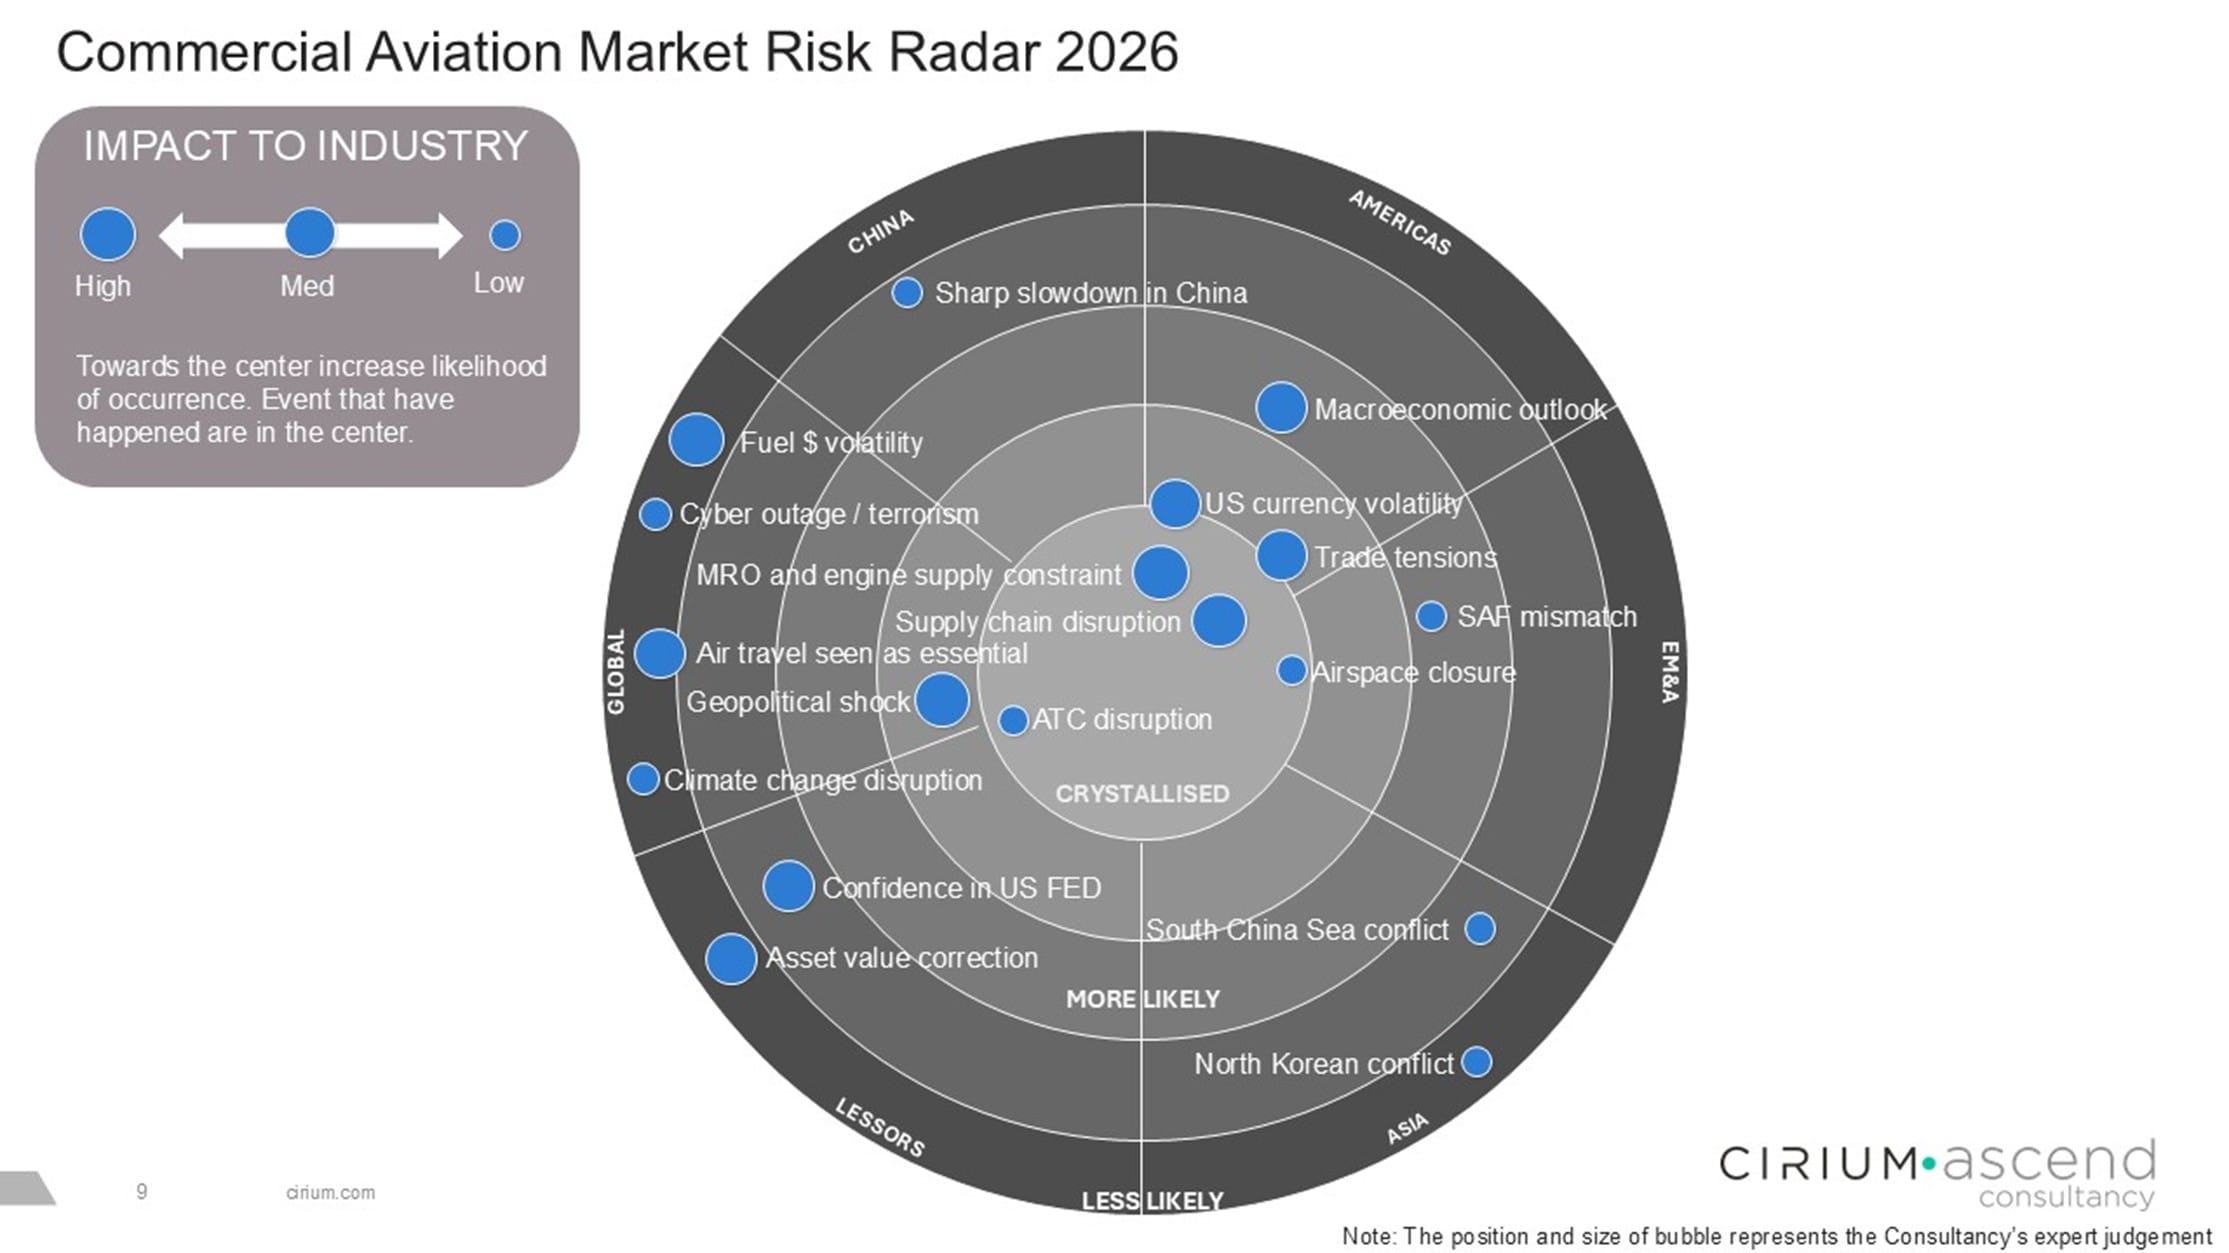
    The conflict affects aviation in three ways:

    1. Airspace closures
    2. Rising fuel prices
    3. Potential for softer demand – both in the region and globally

    Airspace closures

    • These are already affecting the big three Gulf carriers severely (Emirates, Qatar Airways, and Etihad Airways) but there is risk they may extend to others such as Oman Air, Saudia or beyond
    • 20% of all passengers travelling between Europe and Asia-Pacific (incl. Australasia) in 2025 travelled on Middle Eastern carriers – that is 1 in 5 passengers
    • 10% of all US passengers travelling to Asia-Pacific go through the Middle East hubs.
    • Direct flights from Europe to Asia are also affected because they are now limited to just one narrow corridor over Georgia and Azerbaijan, or a longer southern route around Saudi Arabia which adds flight time and fuel burn
    • If Azerbaijan airspace were to close it would put even greater pressure on long-haul flights between Europe and Asia-Pacific, except for those airlines that can overfly Russian airspace (Chinese and Indian carriers, for example)
    • A significant portion of passenger traffic that passes through ME hubs may now decide to avoid the risk of connecting there and book direct flights to their destinations. This could have a positive uplift for European and Asian carriers and could increase demand for long range widebody aircraft especially Airbus A350s, and Boeing 777s and 787s. However, such upside may not materialise if European and Asian economies suffer as a result of higher energy costs and overall demand for travel is affected

    Rising fuel prices

    • The price of a barrel of oil spiked from $60 in January to already exceed $100 – a more than 50% increase
    • While peace negotiations could lead to Brent crude oil prices easing modestly in April, energy information provider ICIS anticipates a “gradually declining but persistent risk premium to remain embedded in prices for the remainder of the year, reflecting continued uncertainty around regional stability”
    • Crack spreads are increasing, meaning Jet A1 fuel is affected even more
    • US airlines are completely unhedged when it comes to fuel price. Southwest Airlines was one of the last to abandon its hedging programme a year ago (March 2025)
    • European and Asian airlines are much better hedged – many have between 45% and 85% of their needs for at least H1 2026 hedged at around $60/bbl or less, some even until the end of the year:
      • Hedged airlines include (but not limited to) Air France-KLM, Air New Zealand, Cathay Pacific, China Eastern, EasyJet, Finnair, Icelandair, Lufthansa, Norwegian, Qantas, Ryanair, Singapore Airlines, Virgin Australia and Wizz Air
      • Hedged airlines will be much less exposed to fuel price increases, while US carriers likely to be impacted harder
      • Some carriers hedge against crude, others Jet A – crude hedges still leave partial exposure to crack spread
    • Cirium analysis and modelling shows that the global airline industry stops making profit (i.e. breaks even) somewhere between $72 and $76 per barrel (sustained, longer term), depending on assumptions. Above that fuel price the industry starts to make losses
    • With higher fuel prices there are two implications to demand for aircraft
      • A greater push for newer-generation, more fuel-efficient aircraft
      • Increased reluctance for airlines to extend leases for previous-generation aircraft or to retain owned aircraft in service for longer
      • In some cases, the increased fuel costs may pressure airlines to offer less in lease rental especially for out-of-production aircraft

    Potential for softer demand

    • There is currently a serious risk of Asian, and to a lesser extent European economies, being affected by both higher energy costs and possibly fuel shortages if the Strait of Hormuz remains de facto closed for longer, and stockpiles run dry
    • For the past few years, we have considered many scenarios that are focussed on aircraft supply increasing to meet demand. For the first time in a while, we must consider the risk of a drop in demand as something increasingly plausible, potentially occurring sooner than expected. This could be especially critical as the manufacturers are making their biggest ramp-up in production over the next three years or so
    • If the conflict extends beyond the next month or two, the risk of an impact on air-travel demand becomes exponentially greater, and could firstly start to impact aircraft lease rates, and eventually aircraft values with previous-generation, out-of-production types being more vulnerable
    • Airlines operating older, less-fuel efficient widebodies on long-haul services would be worst affected, unless they are hedged at low levels
  • Aviation in 2026: A stable climb or turbulence ahead?

    Aviation enters 2026 with momentum, experiencing resilient demand, persistent supply‑side constraints and an increasingly uncertain macroeconomic environment.

    In The 2026 Aviation Market Outlook broadcast live on 4th February 2026, Stephen Burnside, Richard Evans and Daniel Hall explored the key factors shaping the sector to unpack what this means for airlines, lessors and the wider industry.

    Mixed macro signals leave less room for error

    From a macroeconomic perspective, the headline indicators point to an environment that supports air travel demand. Purchasing managers’ indices (PMIs) remain high, key economies are growing, and productivity metrics are rising sharply – all good news for the aviation industry. As Stephen Burnside noted, “PMIs are doing great… if it’s above 50%, we’re expanding,”

    However, consumer sentiment is weakening, and external shocks threaten to create abrupt economic corrections. “The US is central to our 2026 outlook… we like to keep a very close eye on the US because it does really drive the entire world economy” Stephen explained, adding that the impact of a US policy error impacting trade and undermining economic growth was the “number one risk for our outlook for 2026”. While aviation enters 2026 with momentum, the industry has less margin for error. With debt‑to‑GDP ratios elevated and geopolitical tensions unresolved, any shock could have a faster and more pronounced impact than in previous cycles.

    Demand and capacity appear balanced – regional divergence tells a different story

    After years of disruption and recovery, 2025 marked a return to more conventional aviation market dynamics. Globally, demand and capacity were closely aligned, with only marginal changes in load factors. “If you just stood above, if you didn’t know anything else, you’d say well demand and supply look fairly in balance,” observed Richard Evans, highlighting how far the industry has come since 2019.

    That balance, however, hides a widening gap between regions, markets and segments. Forward schedules show continued growth into 2026, but at a more measured pace, and with clear divergence by geography. Asia‑Pacific, the Middle East and Africa continue to see demand outpacing supply, while North America and Latin America experienced load factor declines earlier in the year.

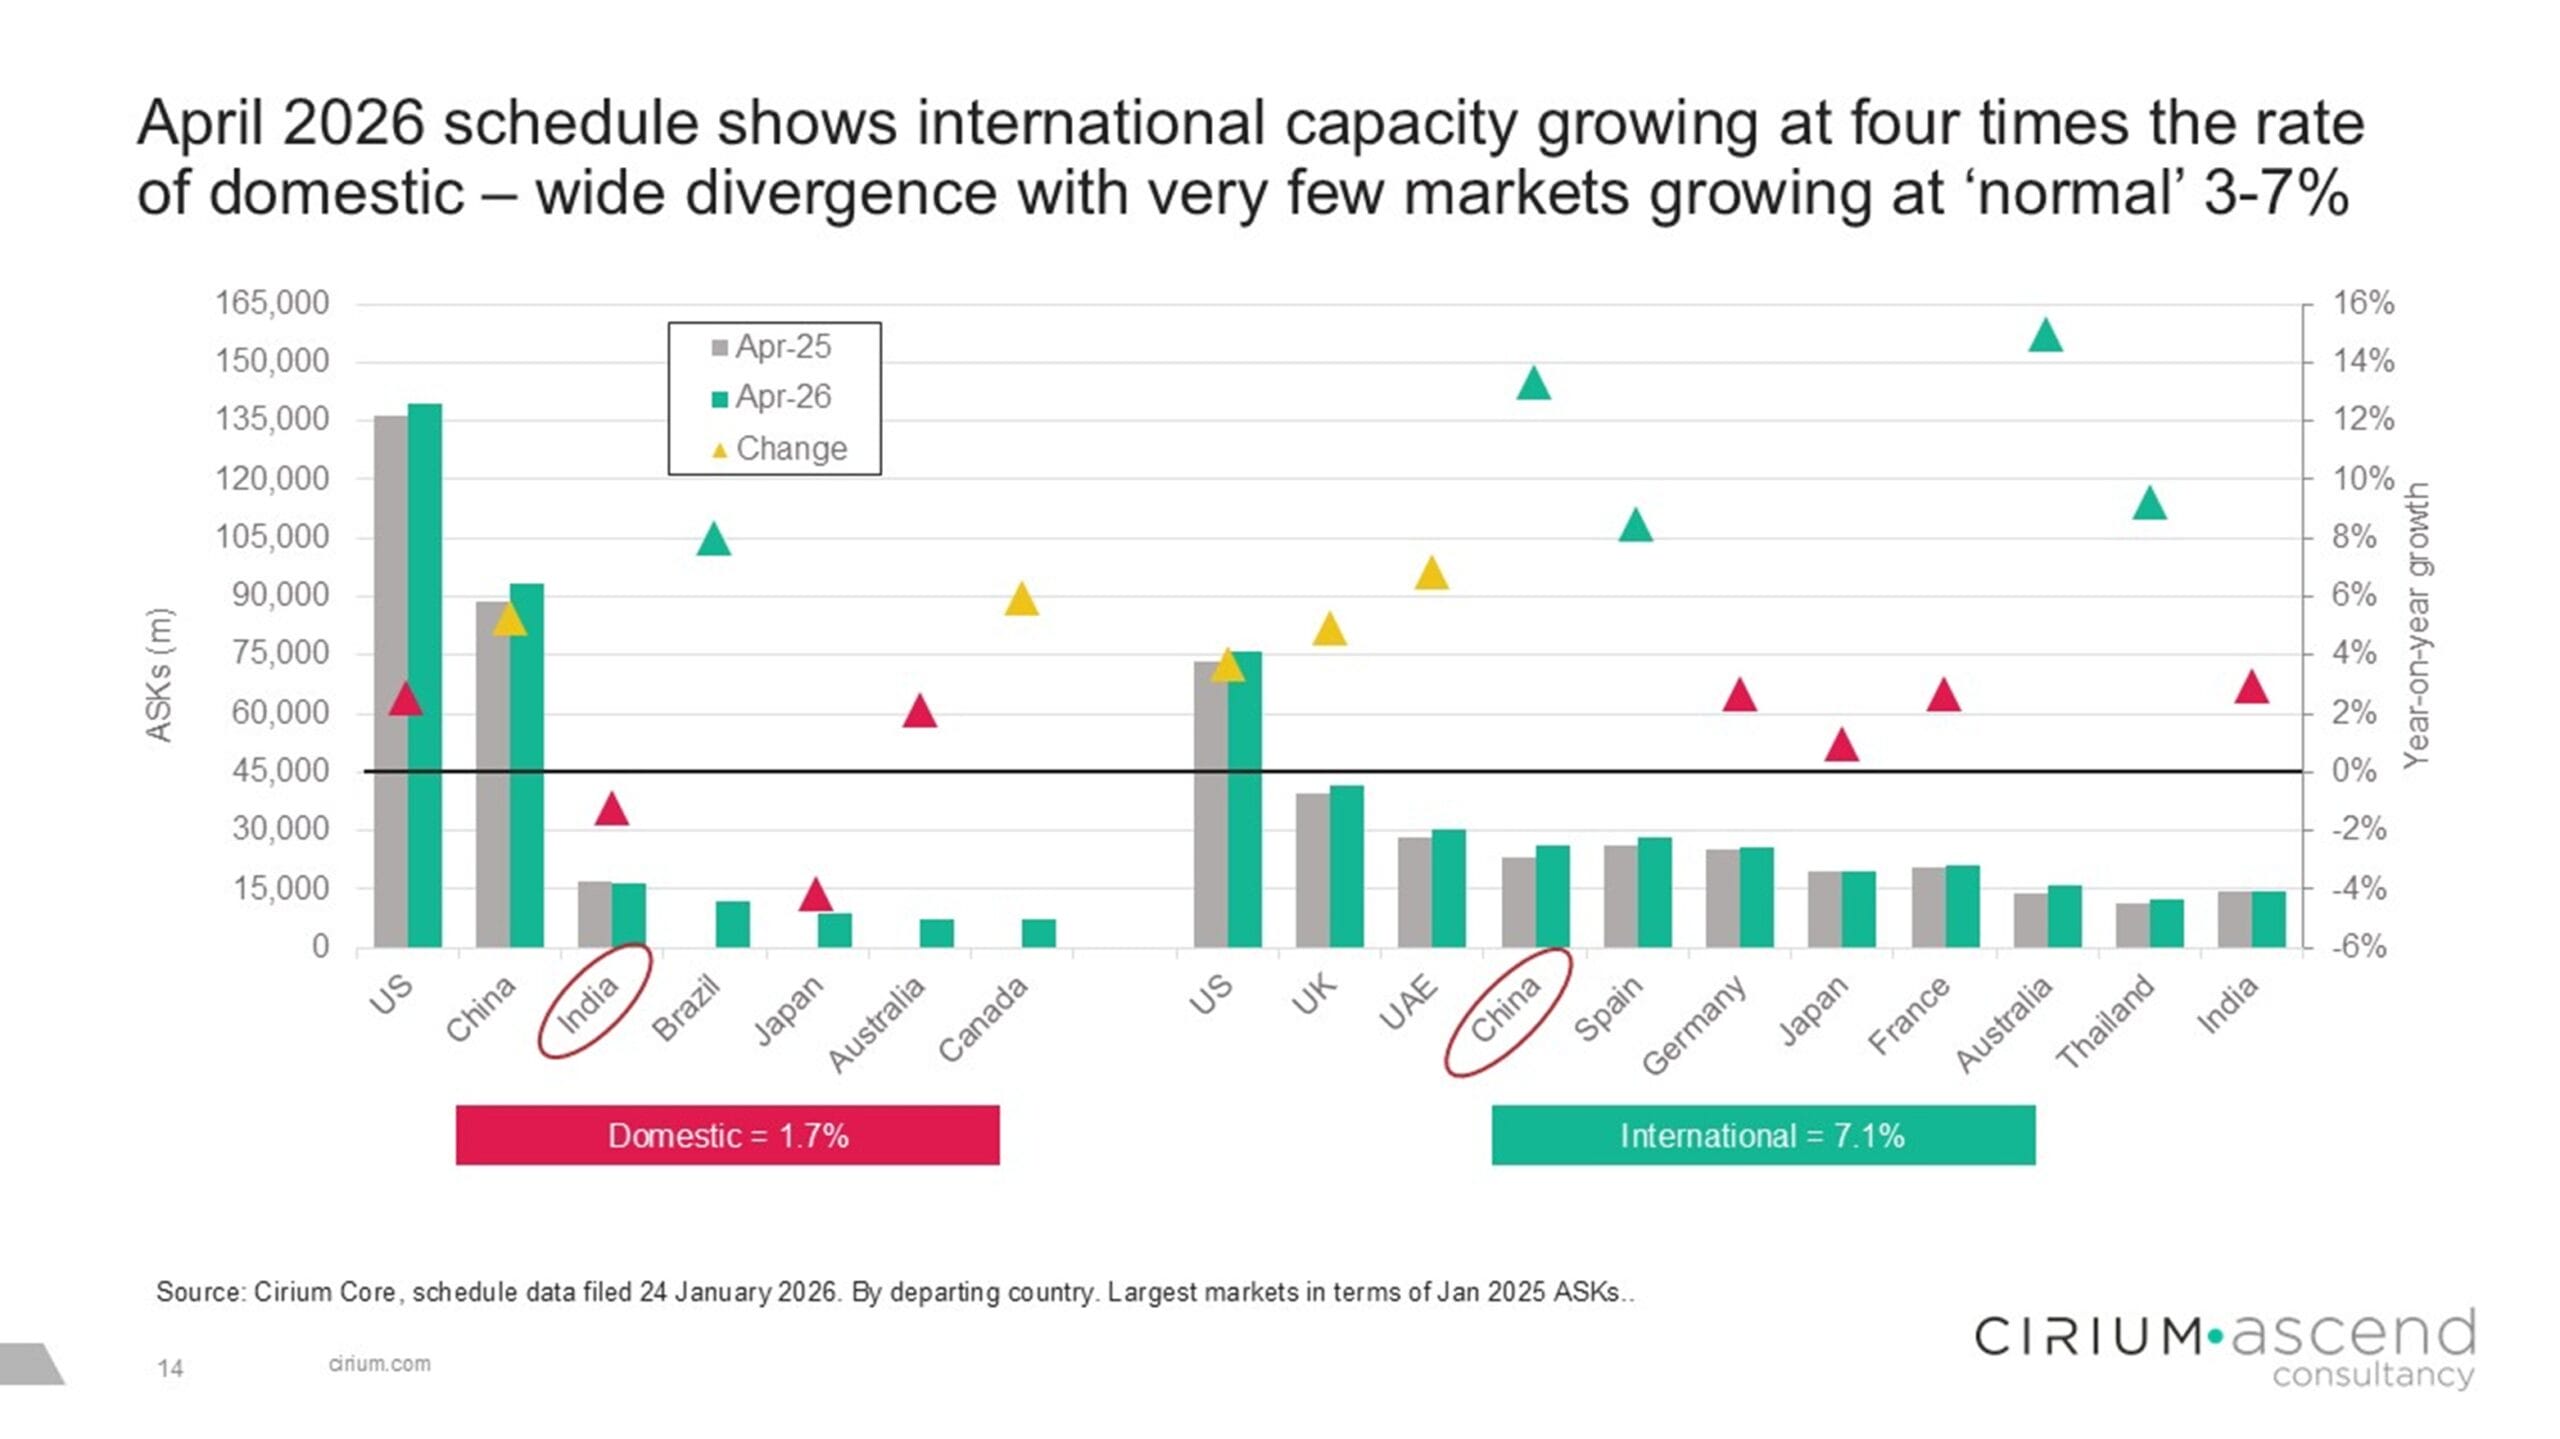
    This unevenness is set to persist in 2026. International capacity is growing far faster than domestic, while some major markets are barely expanding at all. Airline performance will depend on “whether the market is growing strongly or not, but within that what the balance of competition is and the opportunities for yield expansion on the international side.”

    Aircraft and engine values stay elevated with widebodies scarce

    Tight supply conditions continued to support aircraft and engine values through 2025, with diverging dynamics between segments. After years of suppressed production, widebody availability is now extremely tight as international demand has fully recovered.

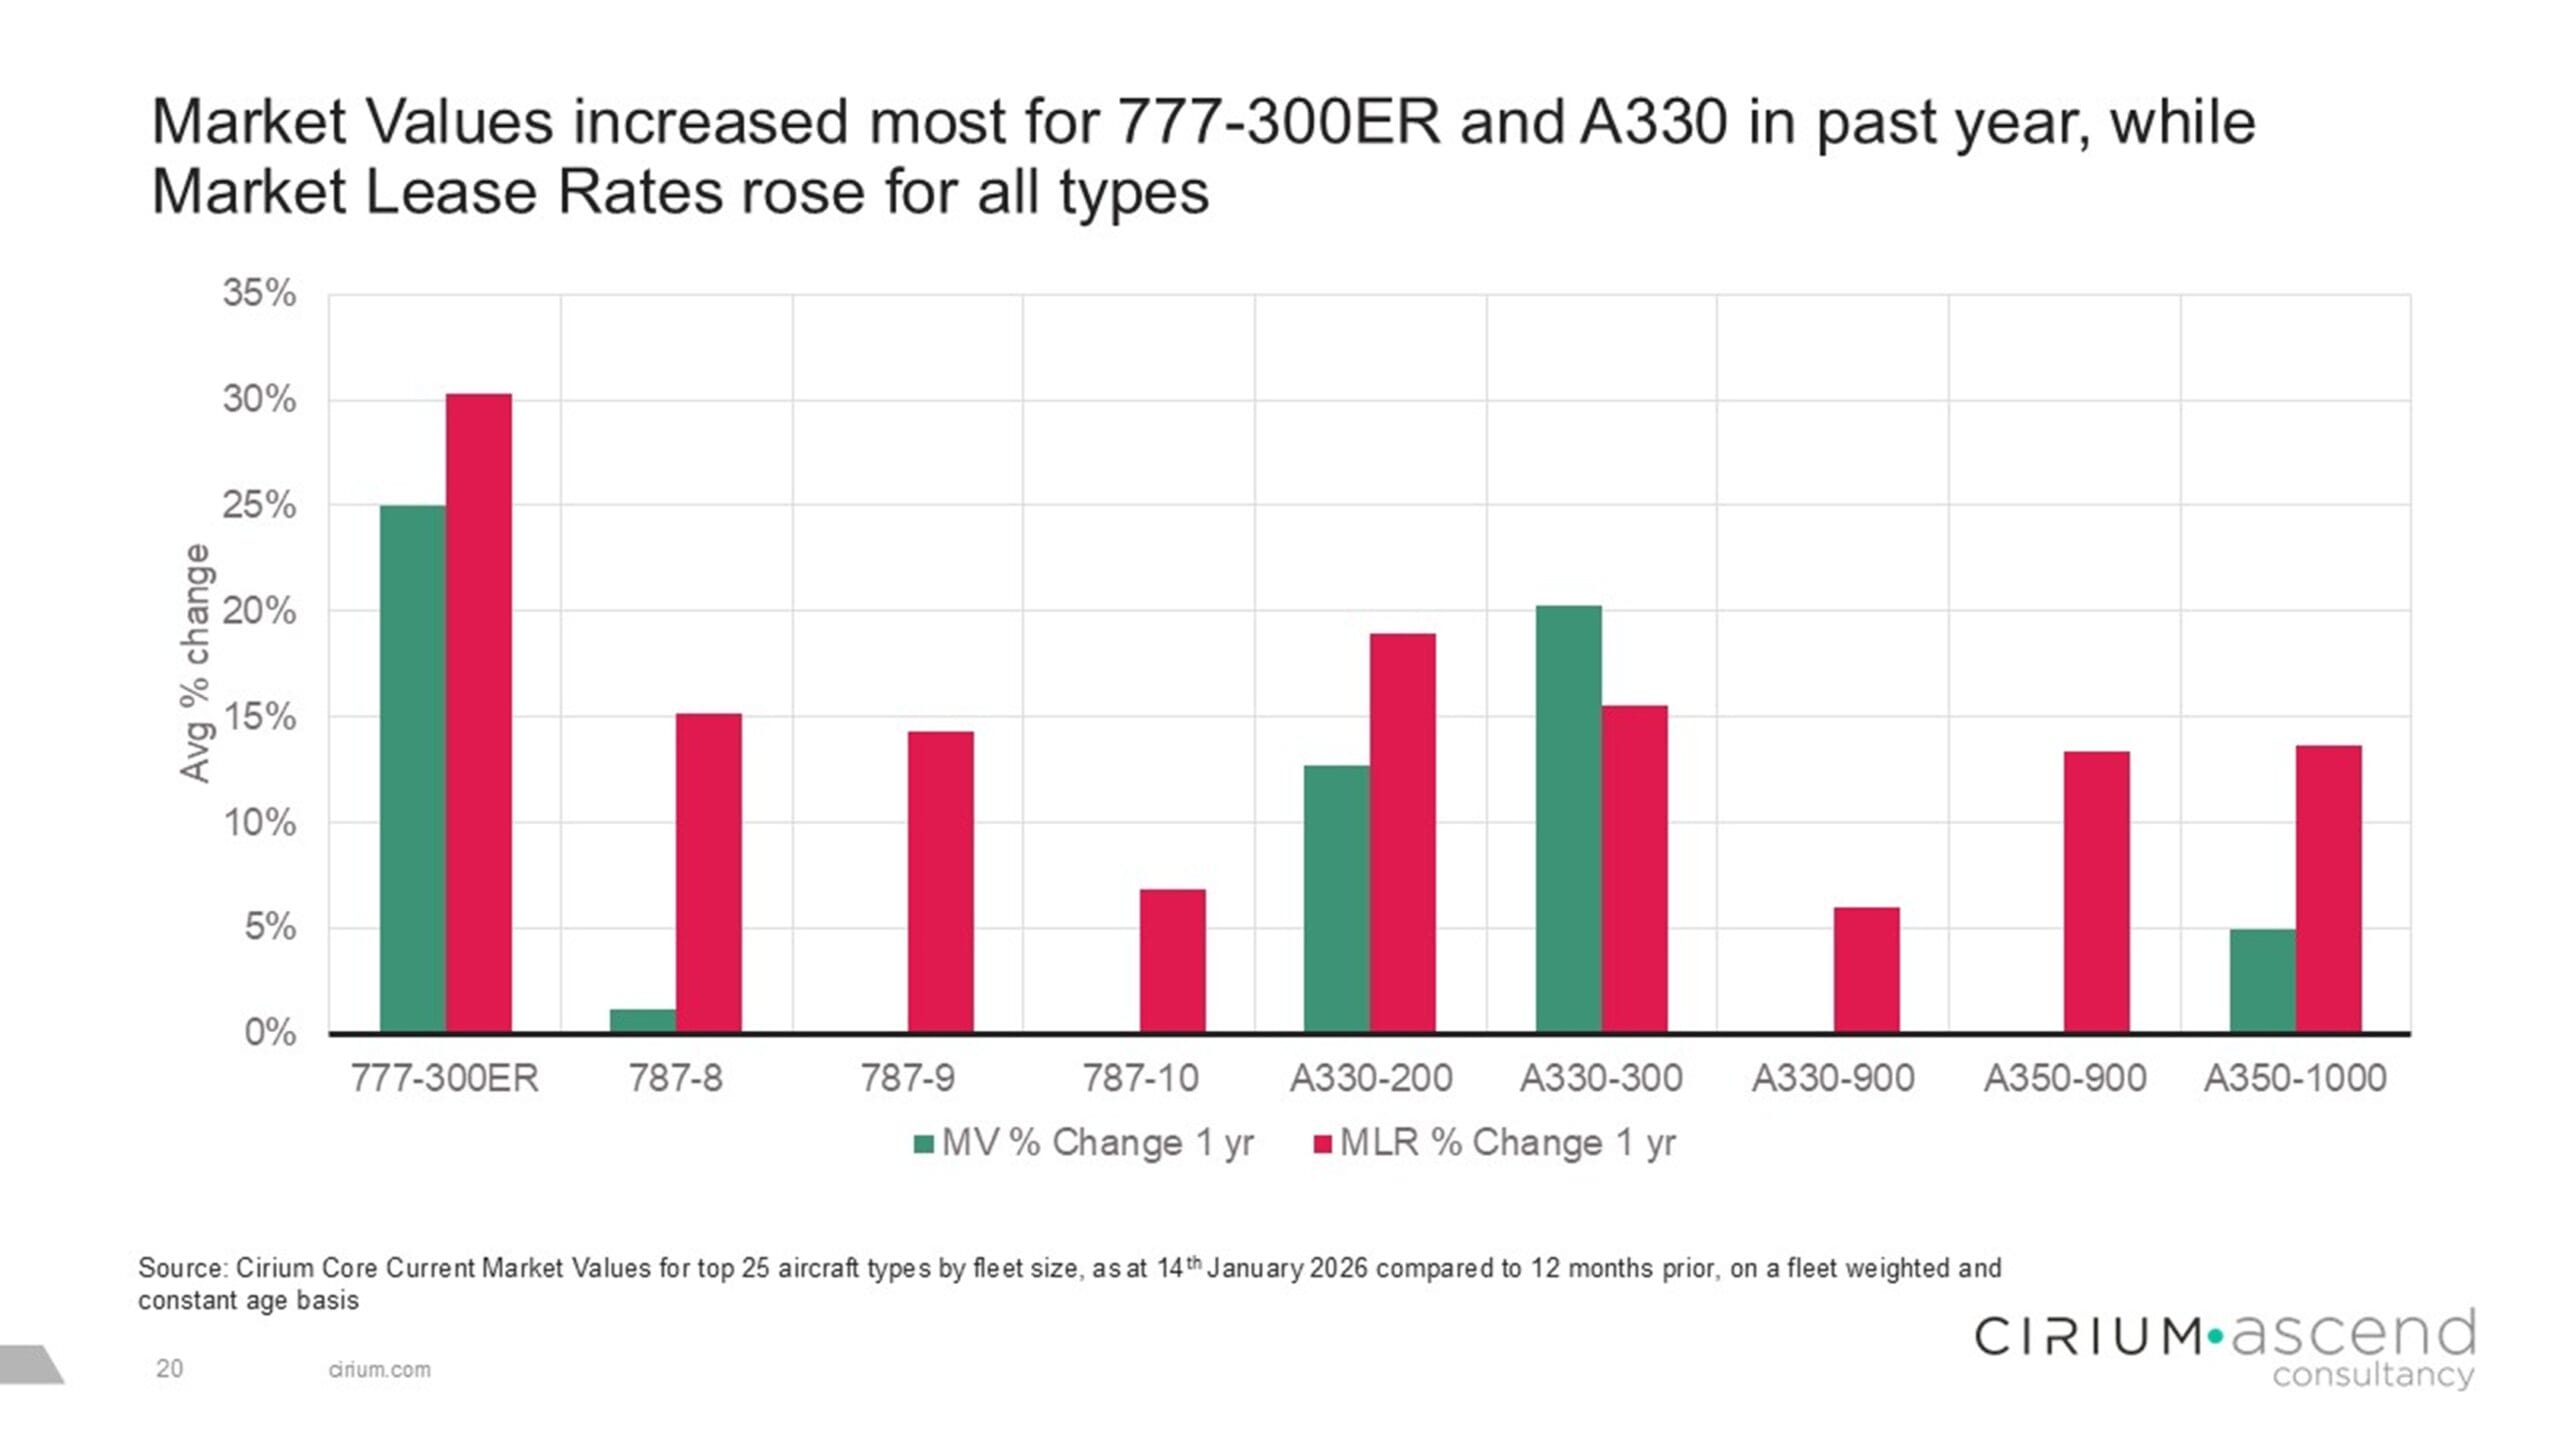
    By contrast, the single‑aisle market has moved into a more stable phase, with market values rising only modestly over the past year and lease rates largely unchanged, reflecting improving production visibility and a highly competitive lessor landscape despite ongoing engine‑related constraints.

    In the widebody market, Daniel Hall pointed to twelve months of growing market values, and lease rates rising by more than 14% on average last year. “If you speak to a lessor today and try and get your hands on a widebody under 15 or 20 years of age, I believe there are none available today.” This is pushing airlines to invest heavily in twin-aisle cabin refurbishments and sustaining pricing power for lessors and owners. While production rates are improving, they are not picking up fast enough to rebalance supply and demand in the next twelve months. “We expect similar this year, but maybe at a smaller magnitude; we have to look at the bigger picture” pointing to another year of lease rate growth.

    Watch the webinar on-demand

    To access the full presentation, including analysis of the impact of the GTF engine issues on single‑aisle capacity, fleet availability and lease‑rate dynamics, register to watch the webinar.

  • Ascend Consultancy: Appraiser of the Year for the 11th time

    DUBLIN (Jan. 27, 2026) Cirium Ascend Consultancy has been named Appraiser of the Year 2026 in the Airline Economics Aviation 100 Global Leaders Awards, the team’s 11th title in 15 years. The Consultancy is a highly respected division of Cirium, the world’s most trusted source of aviation analytics.

    The Appraiser of the Year award recognizes the aircraft appraisal provider that has demonstrated the greatest contribution to the industry over the past year. The fourth consecutive win reflects the trust placed in the Ascend Consultancy team and their work by their industry peers.

    The Aviation 100 Global Leaders Awards celebrate the best companies, individuals and transactions in the aviation finance and leasing sector. Accolades are awarded based on an industry-wide survey and an expert panel of judges.

    To learn how Cirium Ascend Consultancy’s appraisal and advisory capabilities support the insight and analysis of aviation investments, financial strategies and risk, visit: cirium.com/analytics-services/ascend-consultancy


    For Cirium media inquiries, please contact media@cirium.com.

    About Cirium Ascend Consultancy
    Cirium Ascend Consultancy, a division of Cirium, offers market-leading expertise to help inform and drive successful strategies in the commercial aviation industry. With a global team of seasoned consultants and analysts, Cirium Ascend Consultancy delivers comprehensive data, expert insights, and tailored services that directly impact strategic investments and open avenues for growth in aviation.

    About Cirium 
    Cirium® is the world’s most trusted source of aviation analytics. The company delivers powerful data and cutting-edge analytics to empower a wide spectrum of industry players. It equips airlines, airports, travel enterprises, aircraft manufacturers, and financial entities with the clarity and intelligence they need to optimize their operations, make informed decisions, and accelerate revenue growth. 

    Cirium® is part of LexisNexis® Risk Solutions, a RELX business, which provides information-based analytics and decision tools for professional and business customers.  The shares of RELX PLC are traded on the London, Amsterdam and New York Stock Exchanges using the following ticker symbols: London: REL; Amsterdam: REN; New York: RELX. 

    For more information, follow Cirium® on LinkedIn or visit cirium.com.

  • Fleet metrics confirm strong rebound for Airbus’s legacy big twin

    Cirium Ascend Consultancy is trusted by clients across the aviation industry to provide accurate, timely, and insightful aircraft appraisals. The team provides the valuations and analysis the industry relies on to understand the market outlook, evaluate risks and identify opportunities.

    Discover the team’s industry reports & market commentaries. Read their latest expert analysis, viewpoints and updates on Thought Cloud.

    Team Perspective

    Max Kingsley-Jones, Head of Advisory, Cirium Ascend Consultancy

    The Airbus A330ceo’s recovery momentum has continued through 2025, with the -200/300 combined in-service passenger fleet now at 88% of the total inventory. Meanwhile, the number of A330 freighters in service – including both converted aircraft and factory freighters – is close to passing the 100-aircraft mark.

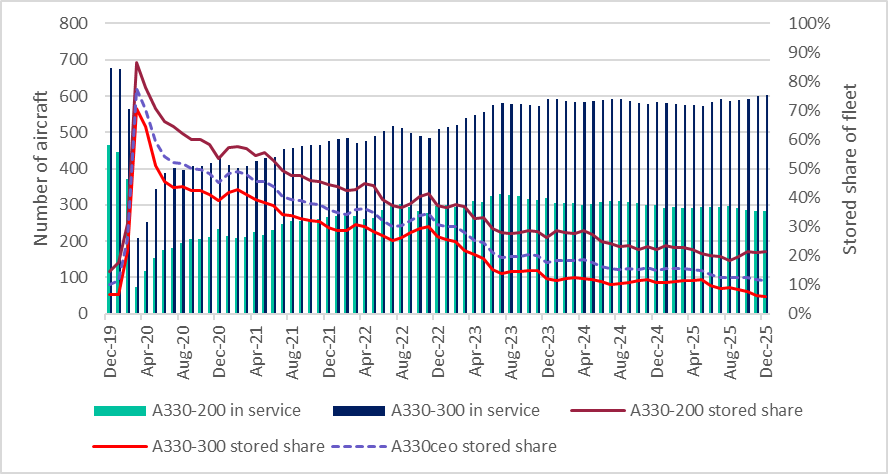
    The A330-300 recovery has fared particularly well, with the in-service passenger fleet having just nudged above 600 units, according to Cirium data (chart 1). This the highest it has been since the Covid crisis began and just 10% below the 680 aircraft in-service tally back in late 2019.

    Just 6% of the passenger -300 fleet remains stored, compared with 21% of the -200’s, which is not enjoying the same strength of recovery as its bigger sister. The in-service -200 passenger fleet is now at around 280 aircraft, having peaked at 330 in mid-2023. The current -200 operating fleet is two-fifths behind its pre-Covid level of 460 aircraft.

    Chart 1: A330 passenger fleet recovery trend

    Source: Cirium Fleets Analyzer

    The ongoing deficit of passenger widebodies has been driving the recovery of the passenger A330ceo market, bolstering Market Values and Lease Rates over the last couple of years. Most recently, Cirium increased Market Values for both the A330-200 and the -300 High Gross Weight variants in September 2025 by 12% on a fleet-weighted average basis.

    The -200/300’s combined storage inventory (115 aircraft) is now less than 12% of the passenger A330ceo’s total fleet. The 26% decline in the stored inventory through 2025 (from 155 aircraft) has been driven by several factors, including: aircraft being returned to passenger service; being converted to freighters or being parted out. Cirium has so far recorded a total of 25 A330ceo passenger retirements for 2025, including 16 -200s and nine -300s.

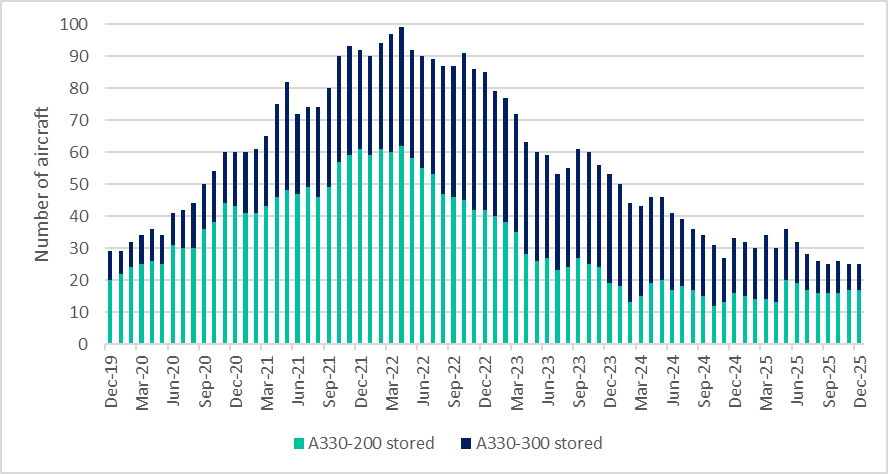
    Chart 2: Lessor-managed passenger A330ceo stored inventory

    Source: Cirium Fleets Analyzer

    The number of stored passenger A330ceos managed by lessors has declined by 25% over last 12 months and now stands at just 25 aircraft (chart 2). This total includes 17 A330-200s and only eight -300s. The lessor-stored tally had peaked in Q2 2022 at around 100 aircraft, and the inventory decline is another good measure of the current health of the A330 market.

    On the cargo front, Cirium data shows that the A330 full-freighter fleet has risen by a fifth over the last 12 months to 97 aircraft, including 38 -200 factory freighters and 59 EFW-converted aircraft (21 -200P2Fs and 38 -300P2Fs). Cirium recorded 13 A330 freighter conversions in 2025 and shows at least 11 more scheduled in 2026, including the first of up to 30 -300BDSFs by Israel Aerospace Industries for lessor Avolon.

    Probably the biggest issue that the A330 conversion market faces is the lack of feedstock due to the strength of demand for passenger aircraft. Given Airbus and Boeing look set to face continuing issues for the next 2-3 years at least in achieving significant increases in widebody deliveries, it’s hard to see any near-term softening of the A330 passenger market – barring of course any unforeseen external factors.