


Team Perspective
Yuanfei (Scott) Zhao, Principal Aviation Analyst, Cirium Ascend Consultancy
Mega-sporting events have historically acted as powerful demand shocks capable of temporarily redrawing the global aviation map. However, as the industry prepares for the tri-nation tournament across North America, historical demand modelling is colliding with a severe supply-side constraint. To navigate this summer’s operational bottleneck, network planners must look beyond headline passenger volumes and understand the interplay between baseline traffic flows and highly elastic “shock markets.”
More broadly, these dynamics sit within a wider “events economy” shaping global aviation demand. World Cups, religious gatherings such as the Hajj, and entertainment-led mega-events like global concert tours all generate short-duration but highly concentrated spikes in travel demand. While differing in purpose, they share a common structural feature: predictable timing paired with highly elastic, often long-haul demand surges that temporarily stress aviation capacity, pricing, and fleet allocation.
Analysis of historical traffic data from the 2018 FIFA World Cup and 2022 FIFA World Cup reveals a critical commercial dichotomy between high-volume origin markets and highly volatile surge markets. Russia 2018 generated the classic Northern Hemisphere summer demand profile, while Qatar 2022 produced a more compressed and operationally complex year-end surge shaped by winter scheduling, Gulf hub connectivity, and post-COVID travel recovery.
In terms of scale, Europe and Asia remain the dominant pillars of international aviation demand. During Russia 2018, Europe moved more than 110,000 monthly passengers into Russia between June and September, peaking at close to 120,000 in July, while Asia maintained volumes above 43,000 monthly passengers (31,000 in January) between July and September. Because these markets already operate at elevated baselines, percentage growth appeared comparatively moderate (+76% for Europe in June vs January). Yet in absolute terms, they formed the financial backbone of tournament traffic, filling most international capacity throughout the event cycle.
Conversely, regions such as South America and Africa function as classic “shock markets.” While their absolute passenger volumes are smaller, their demand elasticity is exceptional. South American traffic surged by approximately +480% during June 2018 (~770) when indexed against January (~130) baseline levels, while Africa recorded growth of more than +140% (~650 Jan vs ~1,600 Jun). These markets demonstrate a strong willingness to absorb long-haul travel costs for football-driven tourism despite smaller underlying traffic volumes.
When the tournament shifted to Qatar in 2022, the same dual structure remained, although the regional hierarchy changed materially. Unlike the 2018 FIFA World Cup, where Europe and Asia dominated inbound traffic, the Middle East emerged as the largest traffic generator, reflecting geographic proximity and the Gulf’s hub-centric aviation structure. Middle Eastern traffic increased by more than +460% into December (~1,600 Jan vs ~9,100 Dec), while Europe and Asia retained the second and third largest traffic baselines.
However, the 2022 cycle was not purely World Cup-driven. The tournament coincided with the broader post-pandemic reopening phase, meaning part of the surge also reflected delayed travel recovery and pent-up demand normalisation. Notably, some long-haul markets, particularly Australasia, began accelerating as early as September 2022, suggesting that pent-up travel demand partially overlapped with World Cup-driven flows.
Crucially, South American demand again proved largely agnostic to geography, expanding by nearly +480% despite the significantly longer travel distance to the Gulf region. Africa similarly recorded growth of roughly +145%, reinforcing the resilience of football-led long-haul demand.
Chart 1: monthly passenger trends by region – 2018 Russia FIFA World Cup
(Scaled index baseline: Jan 2018 = 100)
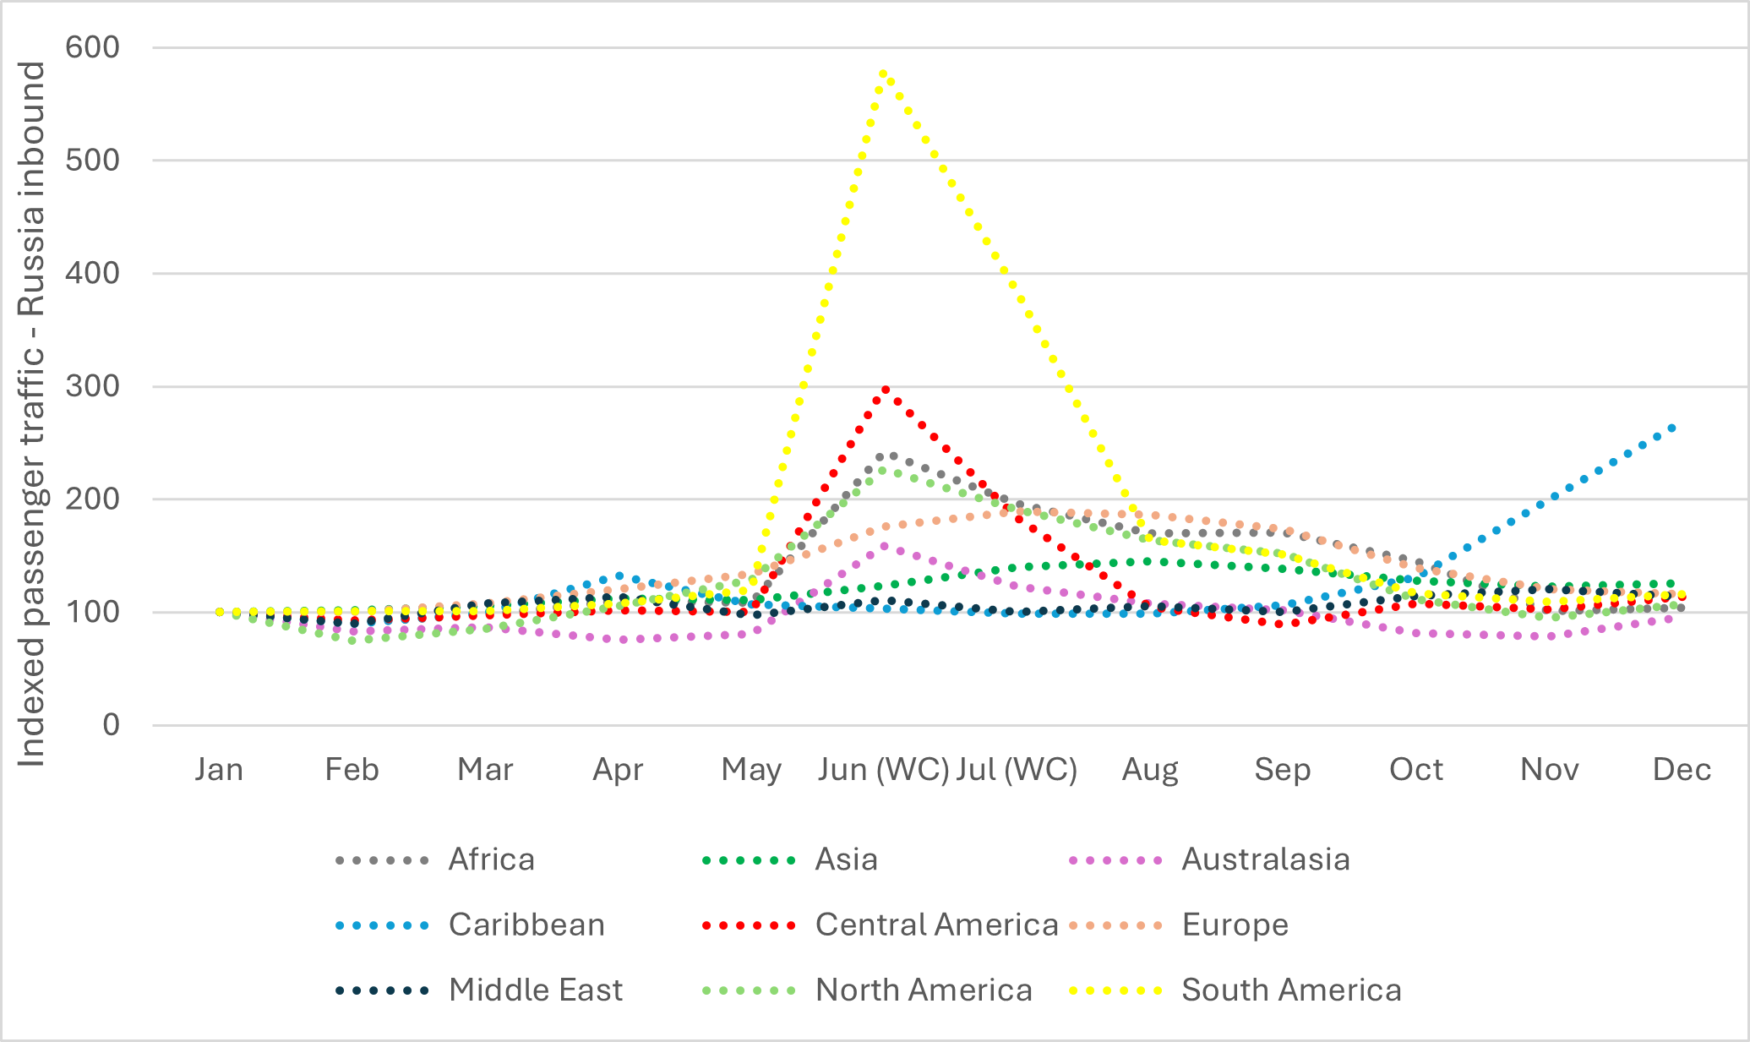
Source: Cirium Core, FMTraffic
Note: traffic volumes are indexed to January of each respective year and region (Jan = 100) to normalize baseline differences across regions and better isolate relative growth trajectories during each World Cup cycle
Chart 2: monthly passenger trends by region – 2022 Qatar FIFA World Cup
(Scaled index baseline: Jan 2022 = 100)
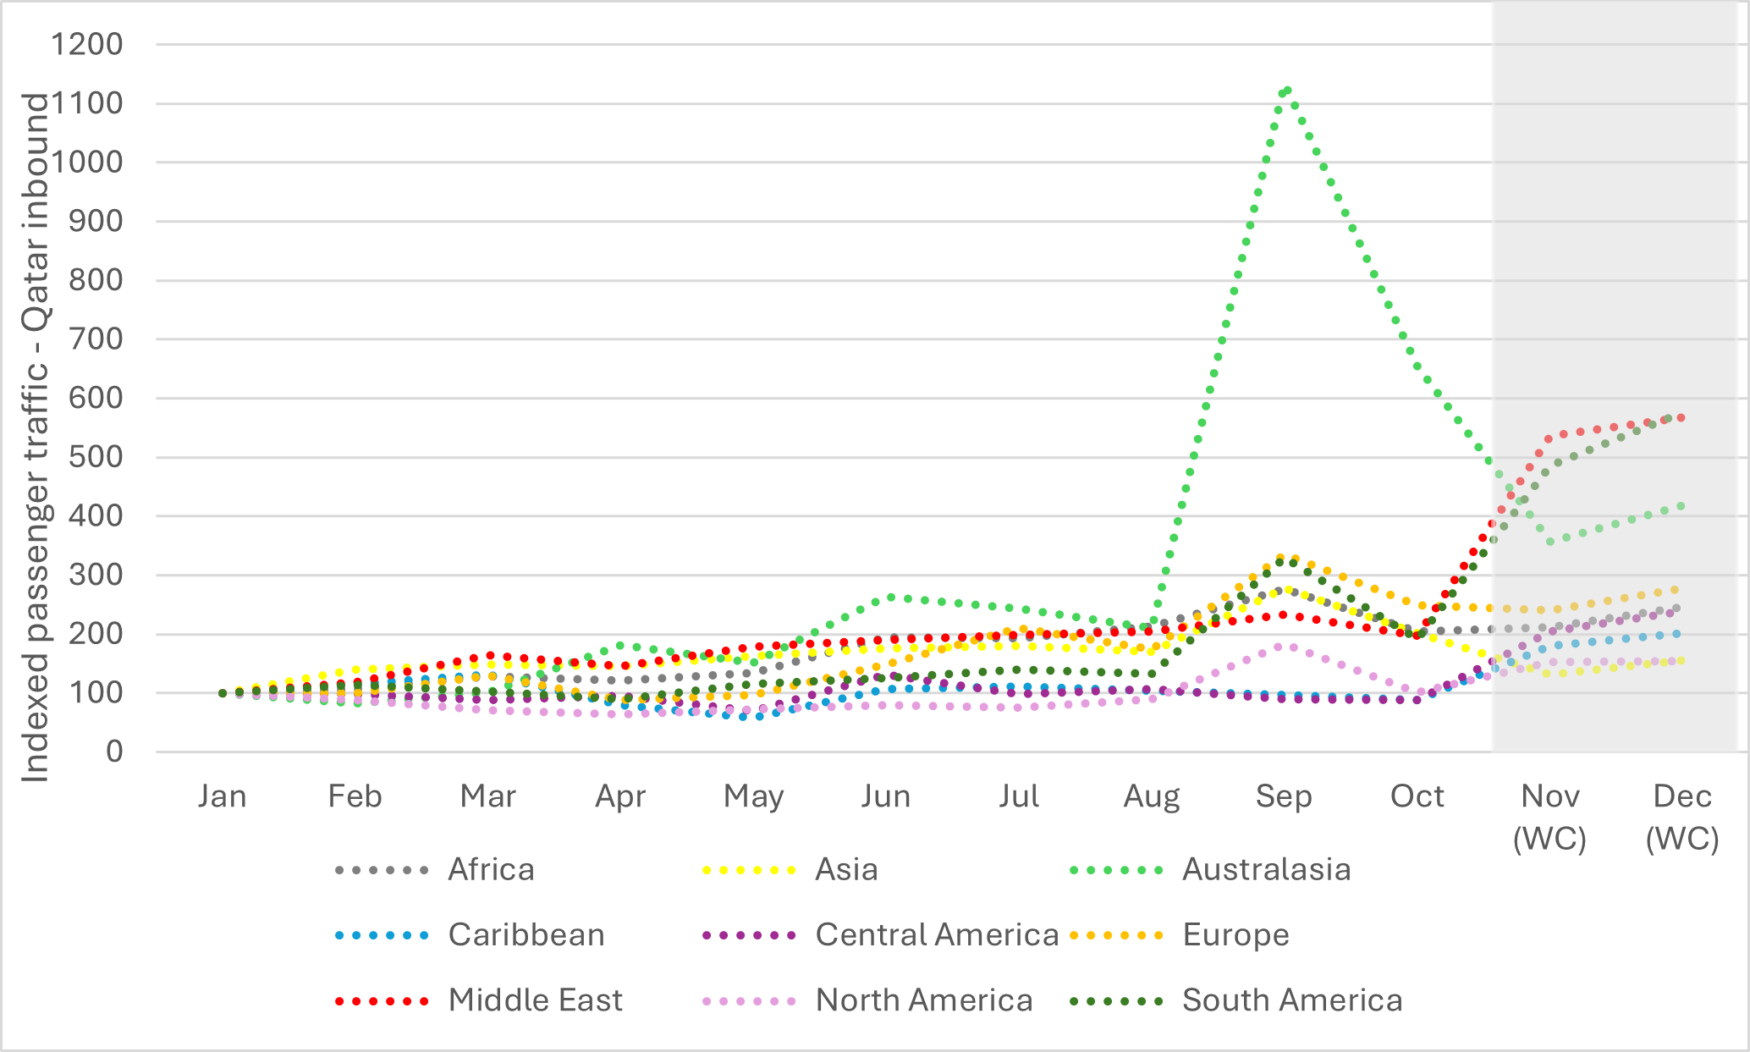
Source: Cirium Core, FMTraffic
Note: traffic volumes are indexed to January of each respective year and region (Jan = 100) to normalize baseline differences across regions and better isolate relative growth trajectories during each World Cup cycle
For the 2026 FIFA World Cup, these high-volume trunk routes from Europe and Asia, combined with elastic surges from South America and Africa, are expected to converge simultaneously on North America. Unlike the 2022 FIFA World Cup, however, North America lacks the same degree of short-haul regional concentration enabled by Gulf proximity and hub connectivity. Consequently, a greater share of tournament demand will rely on long-haul intercontinental capacity, intensifying pressure on fleet utilisation, fuel economics, and network deployment.
This structural shift also arrives under materially different industry conditions than either 2018 or 2022. During Russia 2018, airlines still operated within a relatively stable pre-pandemic expansion cycle, while Qatar 2022 benefited from the rapid restoration of international capacity during the global reopening phase. By contrast, the 2026 tournament is emerging amid tighter fleet availability and a more fragile geopolitical operating environment.
The ongoing geopolitical conflict involving Iran has already disrupted global energy and aviation networks, contributing to higher fuel costs, capacity rationalisation, and operational uncertainty. Airlines have spent much of the recent planning cycle reducing capacity growth and trimming marginal routes, while airspace restrictions across parts of the Middle East are forcing some long-haul services onto less efficient flight paths, increasing fuel burn and operational pressures.
As a result, the challenge for airlines ahead of 2026 is shifting from volume maximisation to disciplined asset preservation. Carriers are likely to rely more heavily on dynamic pricing, fuel surcharges, and yield-based inventory management to protect margins while prioritising high-yield tournament traffic. Network planners may also need to consolidate frequencies and preserve deployment flexibility to concentrate constrained fleet and fuel resources on the highest-performing intercontinental corridors.
These dynamics are not unique to football. Comparable patterns are visible across other global “event shocks.” For example, the Hajj pilgrimage has historically driven measurable aviation system impacts, including a roughly ~3% uplift in engine flight hours during peak periods, highlighting how religious demand waves can materially increase aircraft utilisation across concentrated time windows.
Similarly, large-scale entertainment tours and destination concerts, such as Taylor Swift’s Tokyo shows (estimated ~$228m economic impact), generate short-duration international travel spikes that mirror the elasticity seen in sporting events, particularly in long-haul leisure markets. Even professional golf tournaments (PGA events) create more localised but still meaningful demand concentrations in premium hospitality and short-haul connectivity markets. Across these examples, the common denominator is not the event type itself, but the intensity, predictability, and spatial concentration of demand shocks.
As a result, commercial success during the 2026 World Cup, and across the wider events calendar, will not necessarily belong to the airlines carrying the most passengers, but to those best able to balance demand elasticity, operational resilience, and network discipline. In an environment defined by constrained fleet supply, geopolitical friction, and structurally higher operating costs, the strategic advantage is shifting toward carriers capable of selectively deploying capacity through ACMI arrangements, dynamic network reallocation, and precision yield management during high-intensity demand windows.