






























Mike Malik, Chief Industry Officer, Cirium
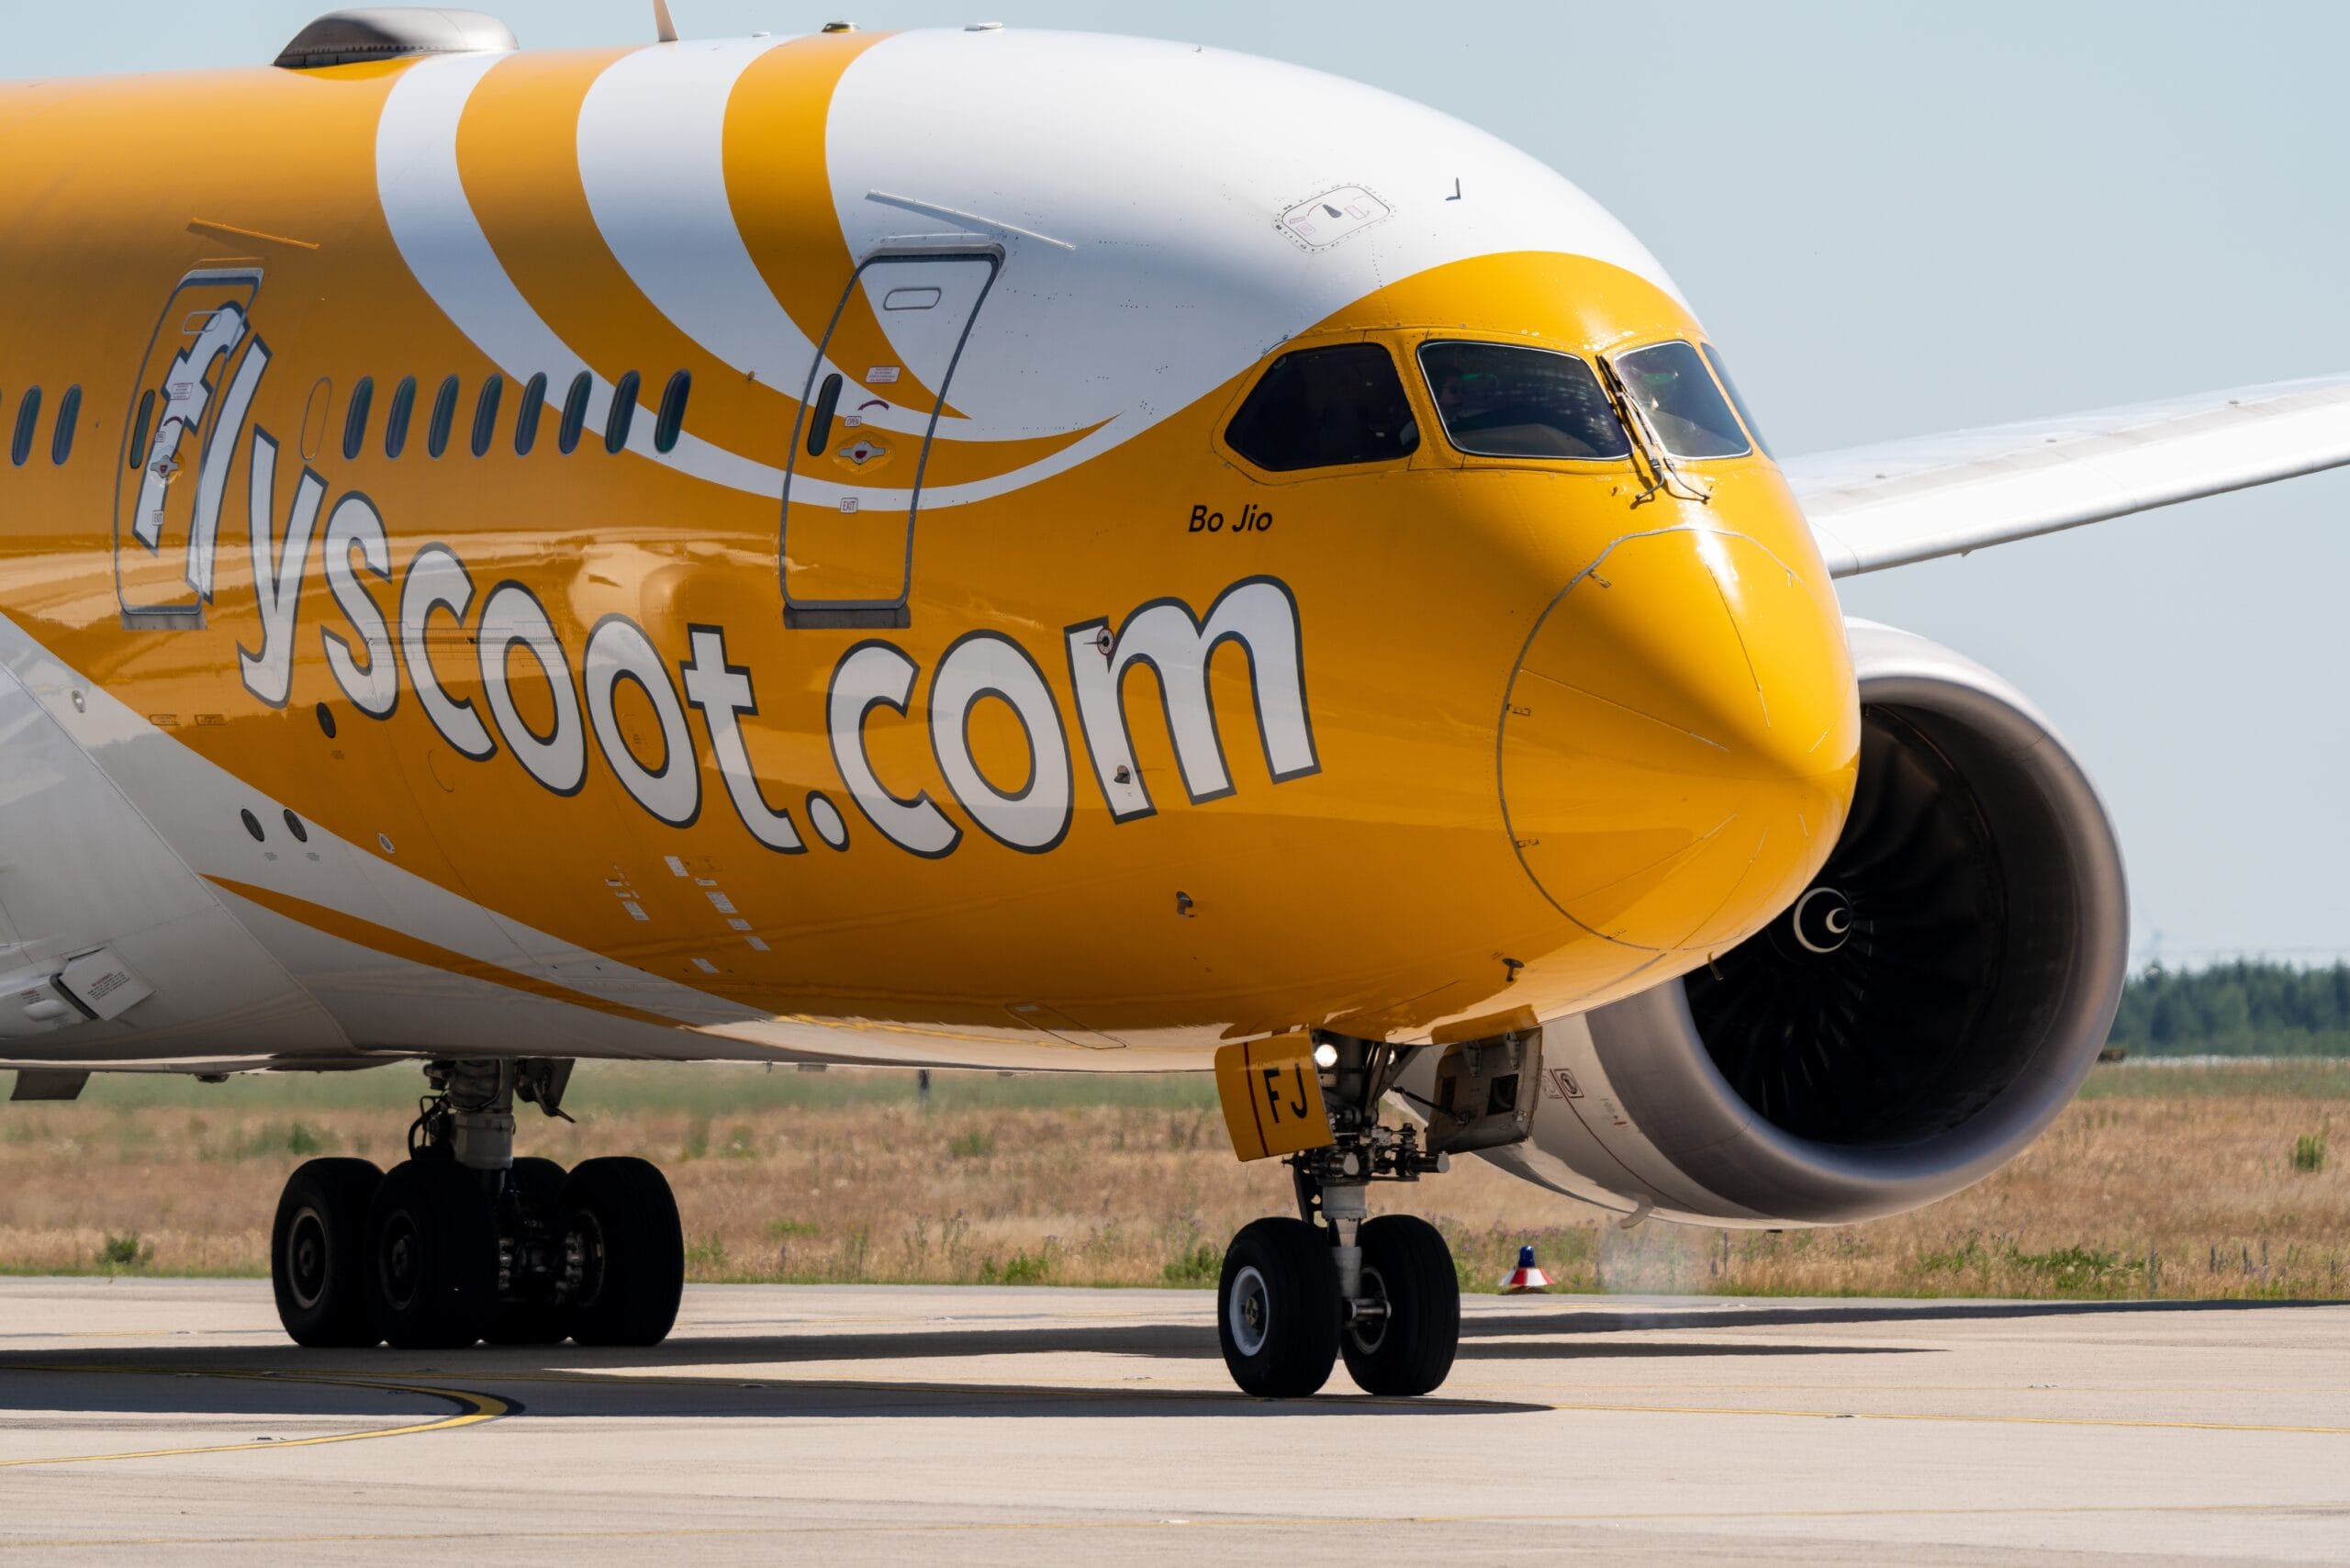
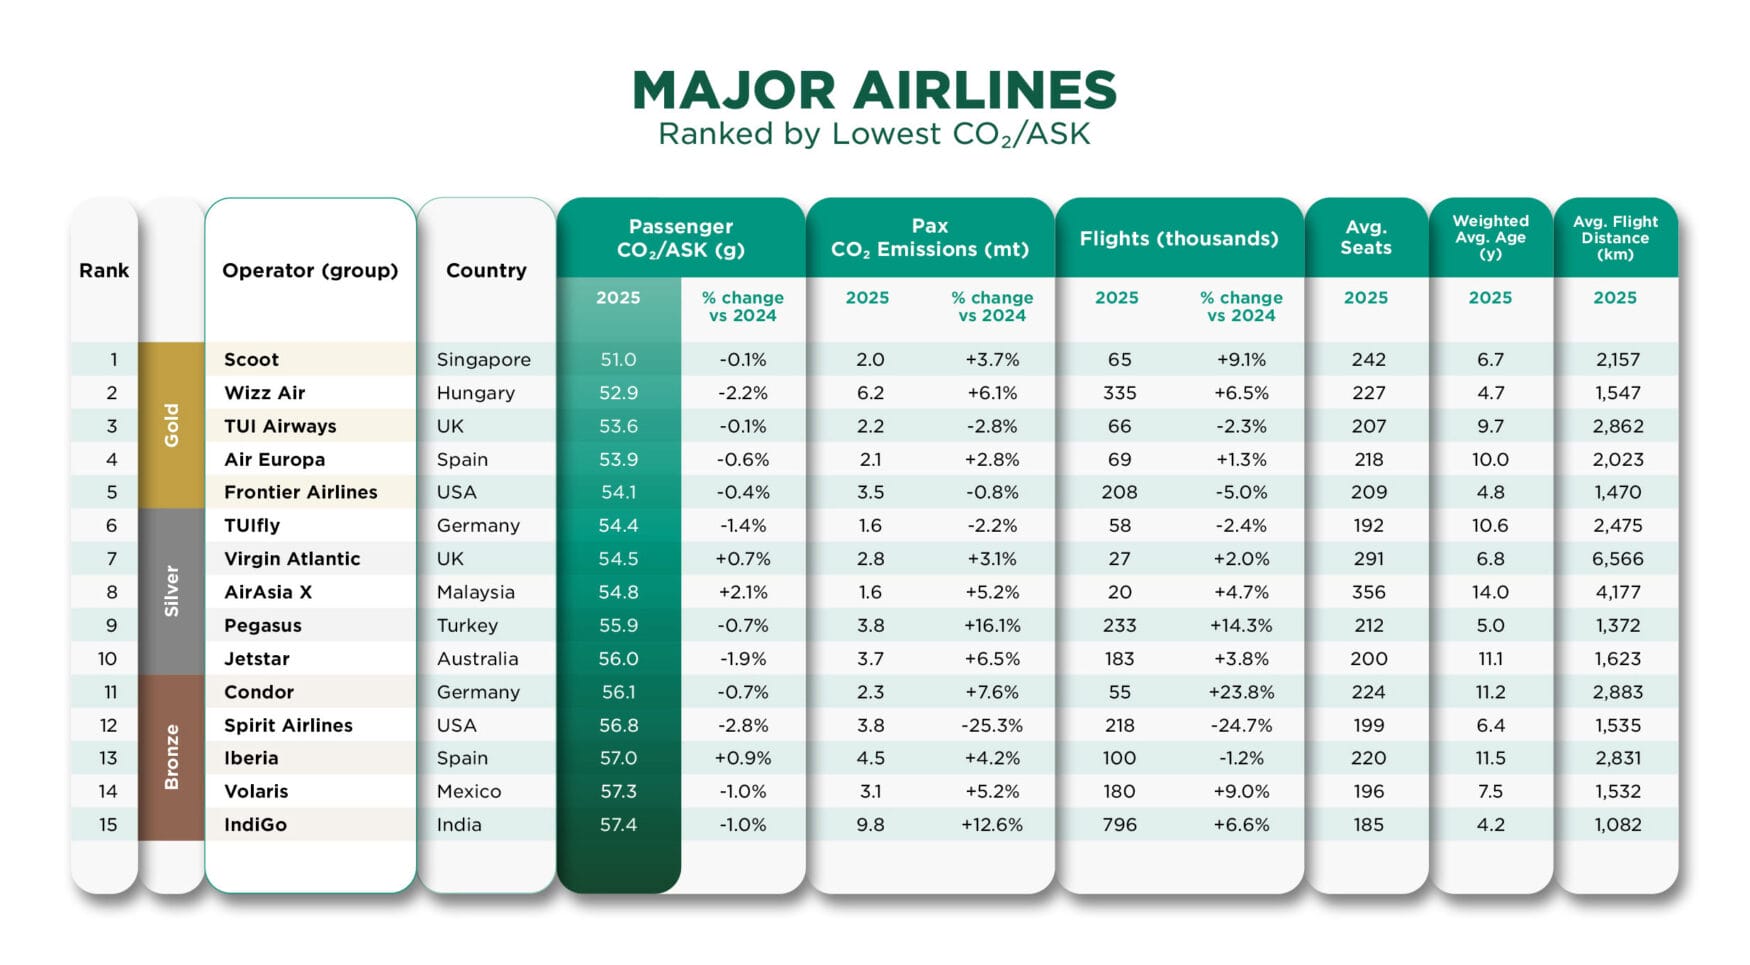
Emissions efficiency is no longer a side calculation in aviation. It is becoming a strategic signal—one that investors, regulators, corporate customers and the public can all read. This year’s rankings show why. Scoot leads the global table at 51.0 grams of CO₂ per available seat kilometre (ASK), ahead of Wizz Air at 52.9g and TUI Airways at 53.6g, based on an analysis of the world’s 100 largest scheduled passenger airlines. But the more important takeaway is not who finished first. It is what the rankings reveal about the airlines that are positioning themselves best for a market where carbon performance increasingly affects cost, competitiveness and reputation. The underlying methodology—based on CO₂ per ASK across the world’s 100 largest airlines and independently assured by PwC—reflects a broader shift in how airline performance is being assessed.
Making Emissions Performance Legible to the Market
One reason rankings often fail to influence the market is that they remain too technical for non-specialists. That is why formalizing the results into Gold, Silver and Bronze matters. The top five carriers earn Gold status for flight emissions, positions six through ten receive Silver, and positions eleven through fifteen are awarded Bronze. A ranking table speaks to analysts; tiered recognition speaks to everyone else. It gives airlines a simple way to communicate complex performance, and it gives external audiences a clearer shorthand for understanding who is leading and why. That matters in a market where environmental credibility is increasingly shaped by what can be communicated clearly, not just what can be measured precisely. The same tier structure is used in Cirium’s EmeraldSky Flight Emissions Review.
What the Leaders Have in Common
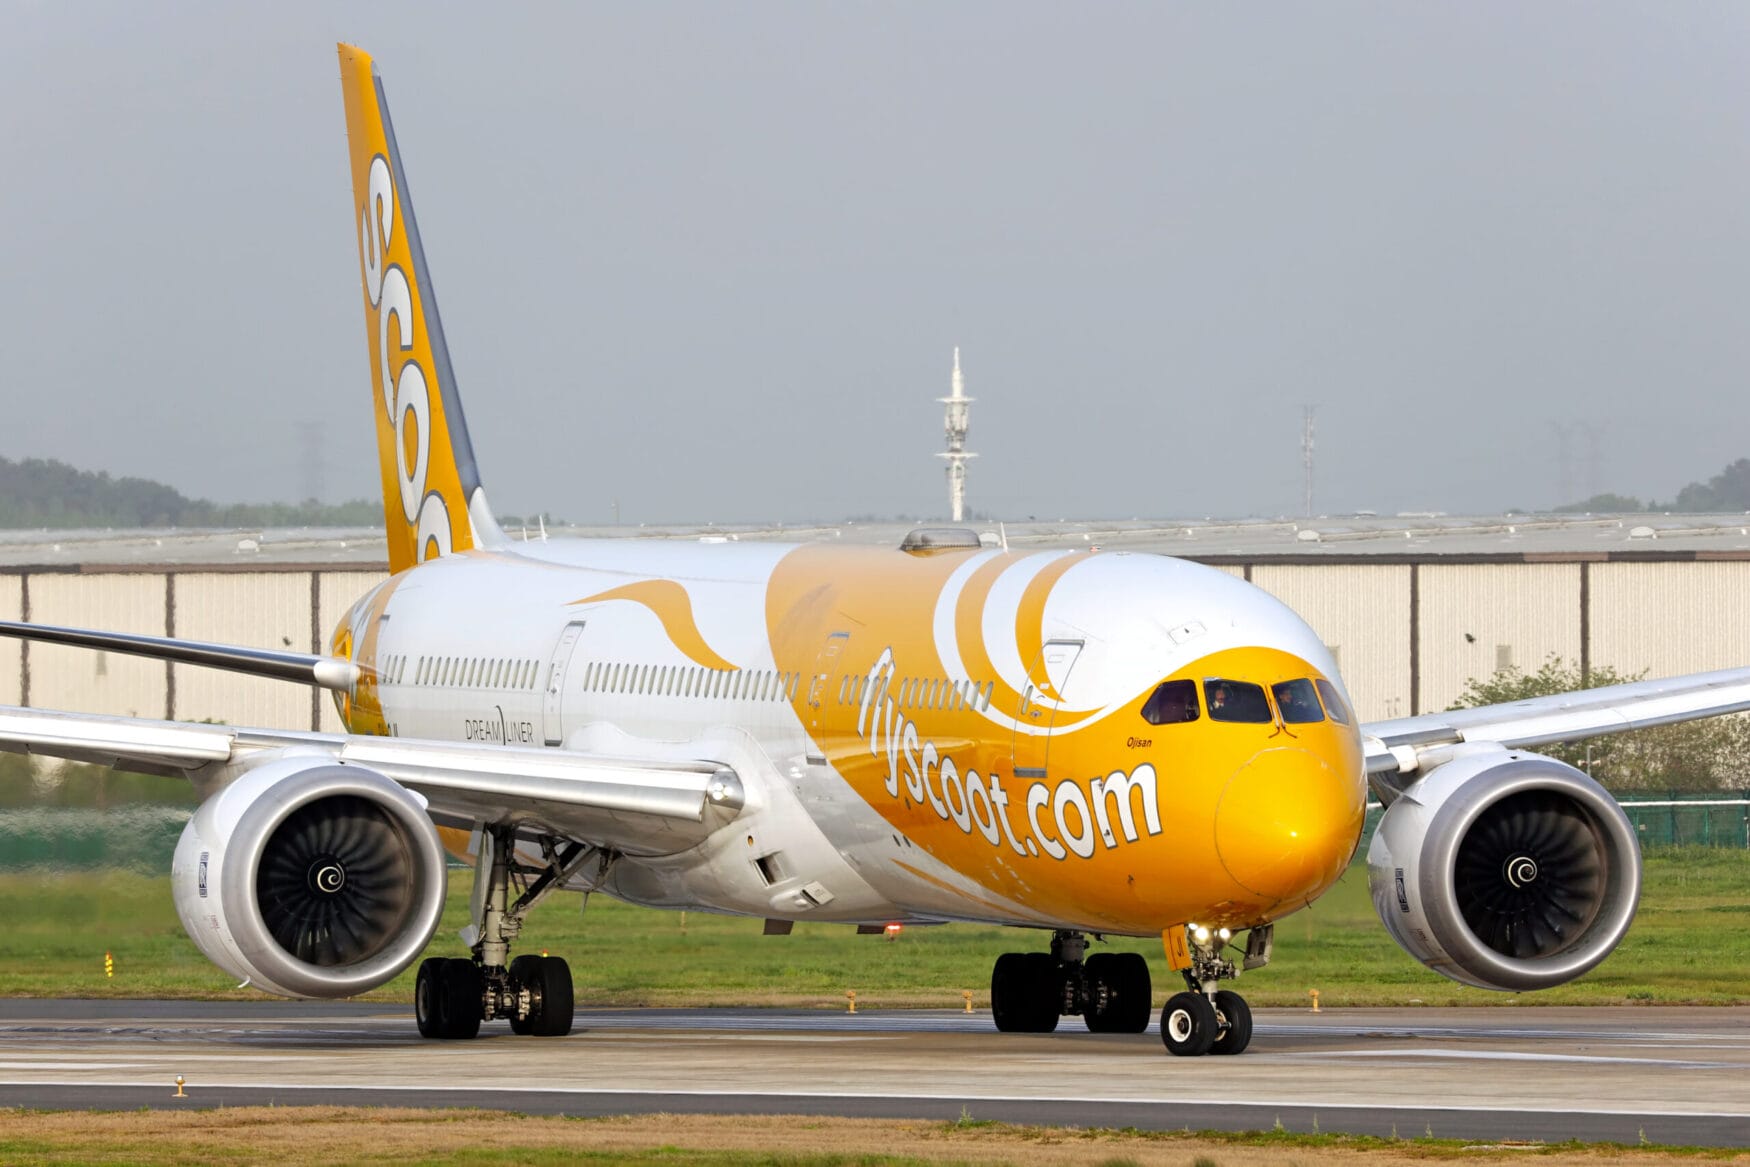

The most useful insight in the rankings is not geographical. It is operational. The Gold tier spans multiple continents and business models, from Scoot’s medium-haul, high-density operation in Southeast Asia to TUI Airways’ leisure network averaging 2,862 kilometres per flight. The lesson is straightforward: there is no single “efficient airline” template. What the leaders share is a disciplined approach to fleet planning, cabin density and aircraft deployment. That should shift the industry conversation away from broad claims and toward the specific operating decisions that actually move emissions performance.
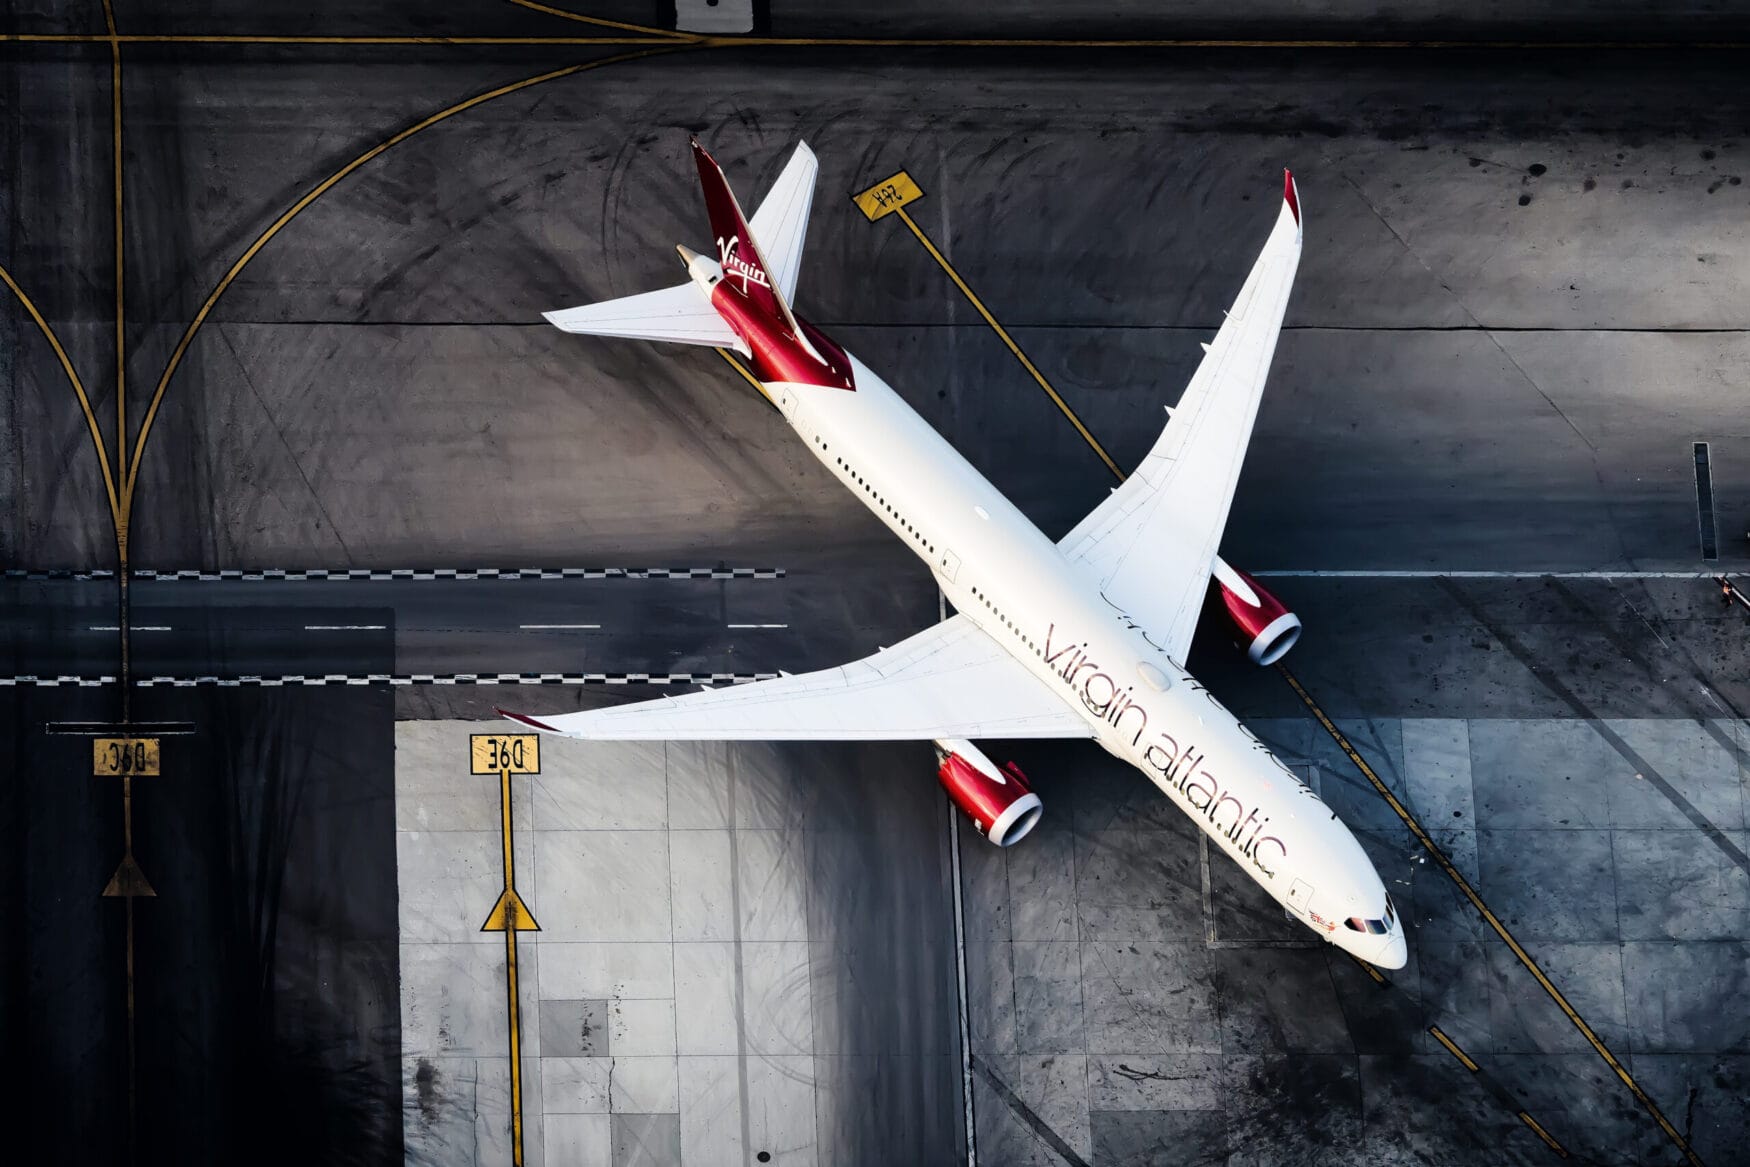

Virgin Atlantic is especially instructive. It delivers 54.5g CO₂ per ASK with an average flight distance of 6,566 kilometres—evidence that long-haul carriers are not locked out of the upper tiers. With a weighted average fleet age of 6.8 years and 291 seats per aircraft, Virgin Atlantic shows that fleet renewal and cabin configuration can narrow the historical efficiency gap between long-haul and short-haul operators. That matters because it reframes the debate: route length influences outcomes, but it does not determine them.
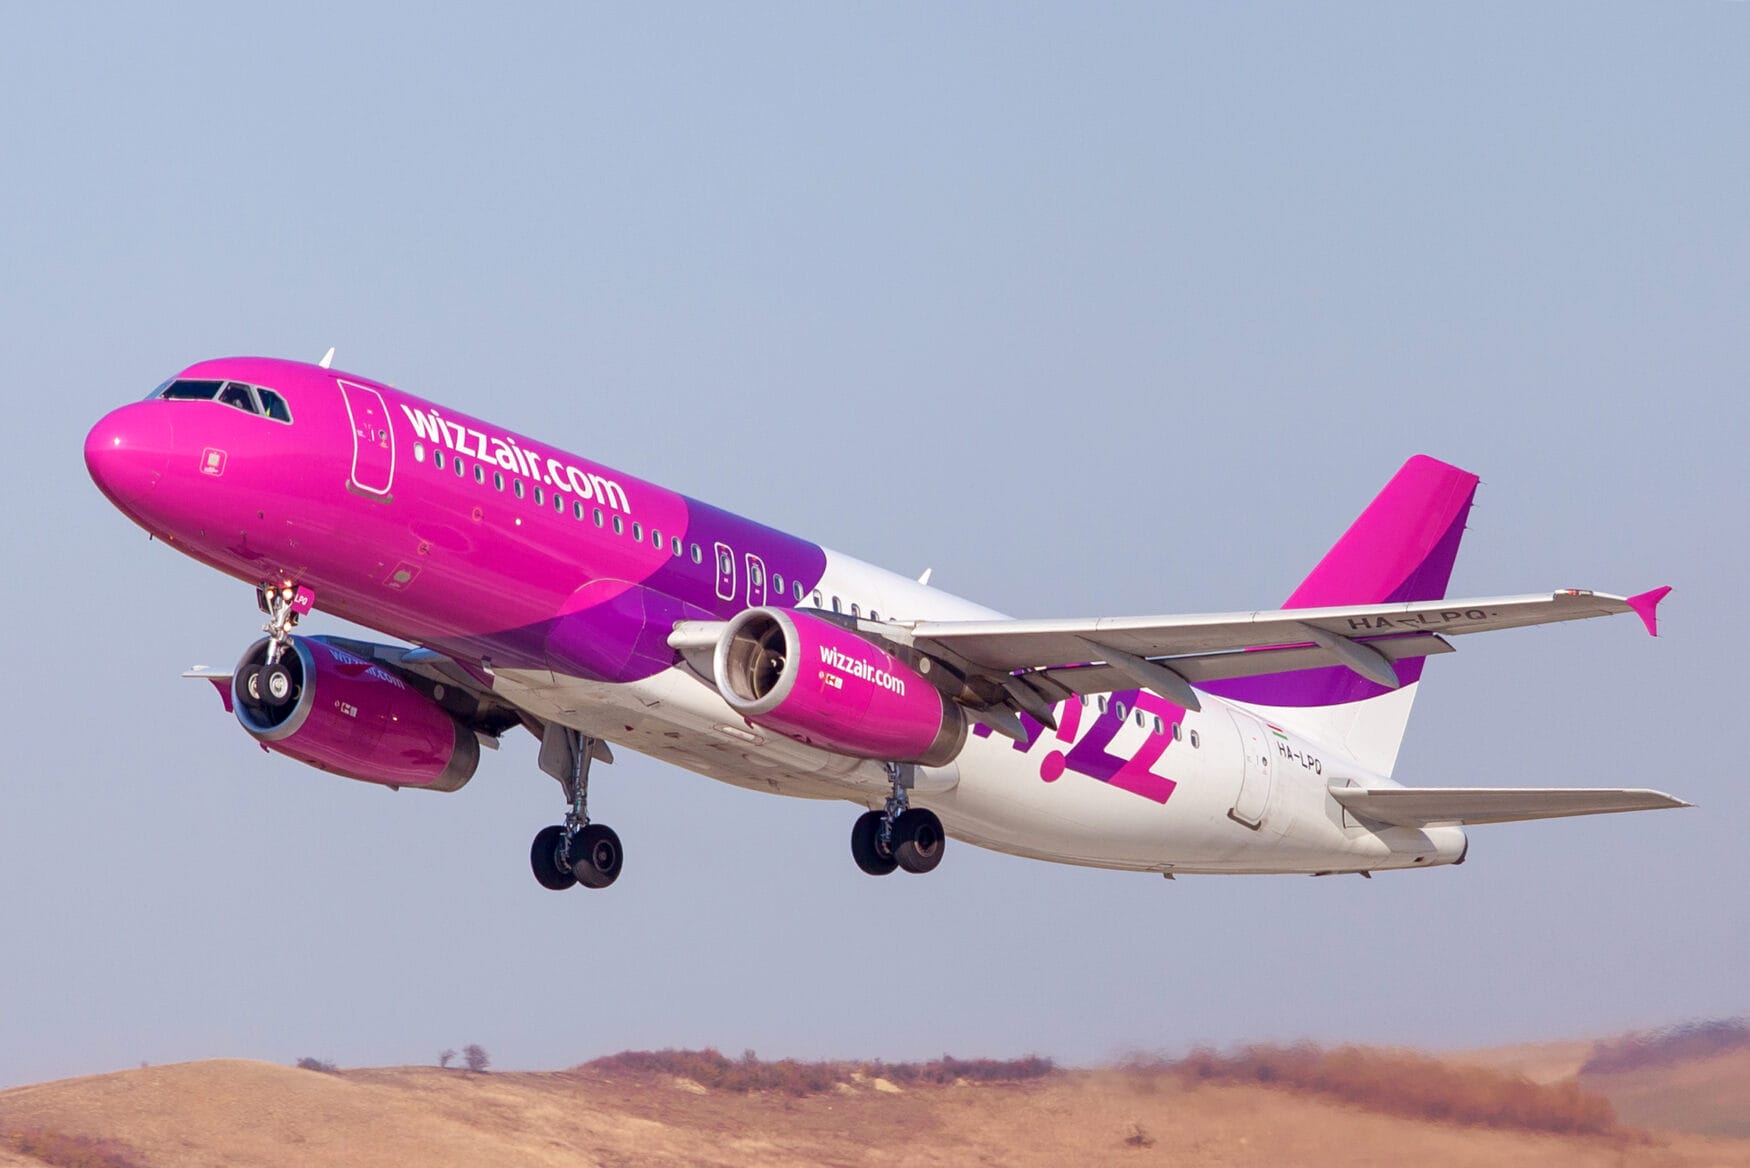
The pattern is becoming hard to dispute: younger fleets and higher seat density remain the strongest predictors of superior emissions efficiency. Wizz Air’s fleet averages 4.7 years. Frontier Airlines sits at 4.8. IndiGo, operating 796,000 flights, still secures a Bronze position with a fleet averaging 4.2 years. At the same time, airlines such as Jet2 and AirAsia X demonstrate that seat count and route selection can offset older aircraft to a degree. The implication for airline strategy is clear: sustainability performance is not abstract. It is the cumulative result of capital allocation, configuration choices and network discipline.
Why Trendlines Matter as Much as Rankings
Static rankings tell only part of the story. Year-on-year change shows which airlines are improving fast enough to change their future position. Cebu Pacific recorded the largest year-on-year improvement in the top twenty, cutting CO₂ per ASK by 3.2%, followed by Spirit Airlines at 2.8% and Jet2 at 2.7%. That kind of momentum matters because it helps distinguish structural leaders from airlines that are actively closing the gap through fleet and network decisions.
That said, investors and analysts should be careful not to confuse improving intensity with falling total emissions. An airline can reduce CO₂ per seat while increasing its overall carbon output if it is growing quickly. Pegasus, for example, reduced emissions intensity by 0.7% while increasing its flight count by more than 14%. This is exactly why benchmark design matters: efficiency per seat and total output answer different questions, and serious analysis requires both.
The tables also display average seats, weighted average fleet age and average flight distance in kilometres. Passengers considering the emissions impact of their travel can use this data alongside the CO₂ per ASK figure to compare carriers operating similar routes.
From ESG Narrative to Financial Exposure
The strategic significance of these rankings is increasing because carbon is moving from disclosure into economics. The gap between the most and least efficient carriers in the top twenty is 7.8 grams—from Scoot’s 51.0g to Etihad’s 58.8g—and across billions of ASKs, those grams become material cost and exposure. In Europe, aviation is entering a new phase of carbon accountability as free EU ETS allowances are phased out and monitoring rules for CORSIA are further embedded in regulation.
IATA has warned that overlapping mechanisms and carbon costs are becoming a competitiveness issue, while the European Commission has continued to implement rules aligning emissions monitoring with CORSIA obligations for 2024–2026. In that environment, emissions efficiency is not simply an ESG talking point. It is becoming a proxy for margin resilience, regulatory exposure and capital quality.
The Next Phase of Airline Competition
The formula is increasingly clear: fleet renewal, seat density and route optimization remain the core levers of emissions efficiency, and they apply across geographies and business models. As Sustainable Aviation Fuel scales—slowly but inevitably—and carbon accounting becomes more tightly connected to commercial and regulatory decision-making, the airlines that already perform well on these measures will enter the next phase of competition with an advantage. They will be better placed not only to lower emissions, but also to defend margins, communicate progress credibly and attract confidence from customers, investors and partners.
What matters now is not simply publishing another table of results. It is establishing a benchmark the market can use. As the dataset expands, the methodology matures and reporting obligations intensify, airline emissions rankings will increasingly influence how carriers are compared, how strategies are scrutinized and how investment decisions are made. The industry does not need more noise in sustainability. It needs a consistent, decision-useful standard. That is the real opportunity for emissions benchmarking in commercial aviation.