Category: Industry

  • How Air Europa is Approaching Emissions Reduction

    Mike Malik, Chief Industry Officer, Cirium

    Air Europa has built a consistent record on emissions reduction over the past decade. The airline has reduced its emissions by 23.58 percent against a 2015 baseline, and won SkyTeam’s annual sustainability challenge in both 2023 for lowest CO2 emissions Short Haul and 2025 for most efficient solution in flight operations. The progress reflects a measured, long-term approach rather than a single headline initiative.

    To understand the practices behind those results, we looked at how the airline thinks about measurement, operations and the path to its 2030 target. What follows is a summary of the work, drawing on insights from the airline’s sustainability team.

    The quotes that follow are from Rosa Nordfeldt, Sustainability Director at Air Europa.

    Starting with Measurement

    Air Europa’s sustainability work began not with ambition but with measurement. Before improvement targets could be set with confidence, the airline invested in the data infrastructure needed to understand its own emissions clearly and consistently. Once that foundation was in place, the targets followed, and the operational practices to deliver against them came after that.

    It is a sequence that gives the airline confidence in the targets it sets, because those targets are anchored in what the data actually supports. It also makes each percentage point of improvement easier to find, because the measurement infrastructure is already in place to identify it.

    Operational Language and Daily Practice

    One of the more distinctive features of Air Europa’s programme is how the airline talks about emissions internally. Rather than treating emissions performance as a separate sustainability concern, the airline made it part of the operational language already in use across flight operations. Emissions performance is discussed in the same conversations as fuel efficiency, route planning and flight performance.

    The result is that the people closest to the fuel burn see emissions as part of their own work rather than something owned elsewhere. That integration is what turns sustainability targets into day-to-day decisions.

    Fleet, Operations and Regulation

    Air Europa operates across two distinct profiles. Short-haul European routes, where competition and turn times shape operations, and long-haul transatlantic services to Latin America, where fleet selection and route structure dominate the emissions picture.

    Both have contributed to the airline’s progress. The transition of the long-haul fleet to the Boeing 787 Dreamliner has delivered meaningful improvements on the transatlantic network. On short and medium-haul routes, the ongoing replacement of the Boeing 737 Next Generation with the 737 MAX is delivering similar gains. Fleet renewal alone, however, is not the whole answer.

    Route planning, flight procedures and the consistency with which procedures are followed all contribute. The aircraft provides the platform. The discipline applied to its operation determines how much of its potential is realised.

    The European regulatory environment is now reinforcing many of these practices. The ReFuelEU Aviation Regulation (Regulation (EU) 2023/2405) is designed to reduce fuel tankering, the practice of uplifting more fuel than is needed at one airport in order to avoid buying it at another. Tankering can be commercially attractive when origin fuel is cheaper, but every additional kilogram of fuel carried burns more fuel for every kilometre that weight travels. To close that gap, the regulation requires aircraft operators to uplift at least 90 percent of their annual fuel requirement at each EU airport from which they depart. For Air Europa, the regulation aligns with practices the airline had already adopted on emissions and efficiency grounds.

    On Sustainable Aviation Fuel

    On Sustainable Aviation Fuel, the airline takes a measured view. SAF is part of Air Europa’s long-term decarbonisation pathway, but the airline is direct about its current limitations. The strategy treats SAF as one element of a broader transition rather than as a standalone solution, and combines pilots, partnerships and ongoing learning while continuing to prioritise the operational measures that deliver emissions reductions today.

    Current SAF production covers only a small share of global jet fuel demand. The path to 2030 will be paved largely by operational efficiency and fleet renewal, with SAF making an increasing contribution as supply scales up over the coming decade.
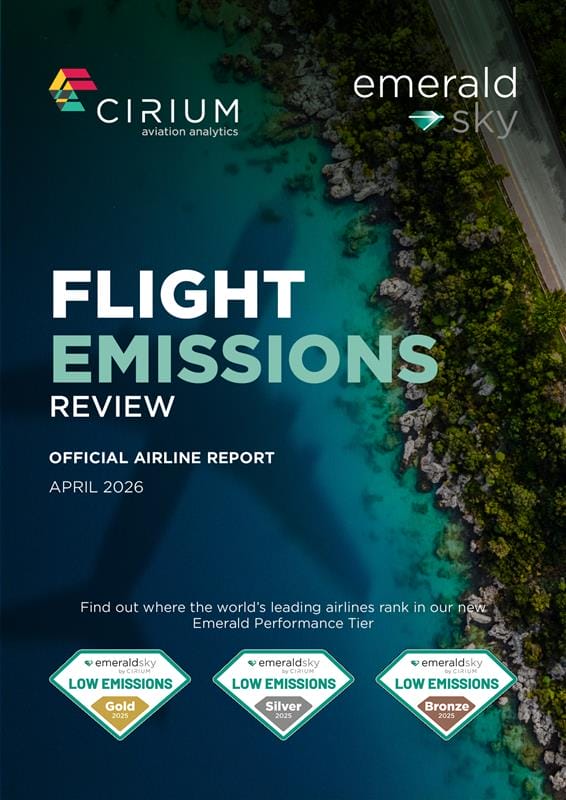
    The 2030 Target

    Air Europa is targeting a 30 percent reduction in emissions by 2030 from a 2015 baseline. With the airline currently at 23.58 percent, the next four years will require sustained discipline to close the remaining gap.

    What gives the airline confidence in that trajectory is the foundation it has already built. The measurement infrastructure is in place. The integration of emissions performance into daily operations is established. The fleet transition to more efficient aircraft is well advanced. The regulatory environment, particularly in Europe, is increasingly aligned with the practices Air Europa has been developing internally for years. The remaining gains will come from continuing to do well what the airline has already learned to do.

    From Compliance to Performance

    One observation captures something important about how sustainability becomes embedded in an organisation:

    Treated as a compliance exercise, sustainability produces compliance results. Treated as a performance domain, it engages the same instincts that aviation has always brought to questions of efficiency, reliability and excellence. Air Europa’s record suggests that the move from ambition to results happens through measurement, integration into daily operations, and disciplined practice over time. It is a path the airline continues to walk, and one its results indicate is working.

    Measure the carbon emissions from a flight, aircraft or seat with unmatched accuracy.

  • The Monthly On-Time Performance Report – April 2026

    View and download Cirium’s full 2025 On-Time Performance Review.

    Download the April 2026 On-Time Performance Report

    When you submit the form, you will be redirected to the latest Monthly On-Time Performance Airline and Airport Report. You will also receive an email with a link to the report for future reference.

    SUBSCRIBE to be the first to hear about new Cirium reports and analyses.

    Global OTP Summary – April 2026

    April delivered a measurable improvement in global operational performance. Flight cancellations declined 43%, with North America and Middle East & Africa recording the steepest reductions — down by up to 81%.

    But lower cancellations also raise the bar. When disruption eases, the industry gets a clearer view of operational performance — separating airlines and airports with sustained reliability from those still catching up.

    Airlines setting the pace

    • SAS led global airline OTP with an 89.53% on-time arrival rate and became Europe’s top performer.
    • Singapore Airlines continued to lead Asia-Pacific.
    • Alaska Airlines remained the strongest performer in North America.
    • Copa Airlines led Latin America.
    • Royal Jordanian stood out as the most-improved airline, increasing OTP by 25 points.

    Global Cancellations Report


    Learn more about Cirium On-Time Performance and download 2025 Reports, here.

  • Intermediate twin helicopters: Market trends and value review insights

    Eleni Maragkou, Valuations Analyst, Cirium Ascend Consultancy

    Between 2015 and 2025, the intermediate twin-engine helicopters have recorded consistent growth in fleet size, resulting in an increase in their share of the overall fleet. This reflects a sustained expansion of the segment alongside broader market growth. Historical fleet data is based on year-end positions, while forecast data reflects the 2025-2034 outlook.

    The Cirium Helicopter Fleet Forecast (2025) indicates that intermediate twins accounted for approximately 10% of total deliveries over the past decade and are expected to increase to around 14% over the next ten years, representing a rise of approximately four percentage points. In value terms, the segment is forecast to represent approximately 20% of total market value, equivalent to around $10 billion between 2025 and 2034. This positions the intermediate twins as the third largest segment by value, supporting their growing importance within the overall market.  

    Chart 1 shows that intermediate twins have experienced consistent growth in fleet size over the past ten years, broadly tracking their share within the fleet mix.

    Chart 1: Intermediate-twin in-service fleet trend – past 10 years

    Source: 2025 Helicopter Fleet Forecast

    The 2025 Helicopter Fleet Forecast highlights the forward outlook for the segment, with intermediate twins expected to account for approximately 20% of total market value over the 2025 to 2034 period. This reflects continued demand for aircraft that provide a balance between capability and cost, supporting their position as a core segment within future market activity.

    Chart 2: Fleet forecast of civil helicopter deliveries by value 2025-2034

    Source: 2025 Helicopter Fleet Forecast

    Fleet development data, further illustrate how these trends translate at an asset level. The Airbus Helicopters H145/EC145 fleet has grown from fewer than 100 aircraft in service in the early 2000s to approximately 900 aircraft by end of Q4 2025. Over the same period, storage levels have remained below 5% of the fleet, indicating that the majority of aircraft are actively deployed. This is relevant from a value perspective, as low storage levels typically indicate that supply is closely aligned with demand, supporting liquidity and reducing the risk of downward pressure on values. At the end of Q4 2025, 486 H145/EC145 aircraft were in service in the Emergency Medical Services (EMS) sector across 74 operators worldwide. This concentration within a single mission profile demonstrates the aircraft’s established role in core segment and supports consistent demand.  

    The Leonardo AW169 shows a consistent growth profile, with the fleet increasing from entry into service 2015, to approximately 200 aircraft by Q4 2025 with storage levels remaining minimal. This indicates that new deliveries are largely being absorbed into active operations. As of Q4 2025, 59 aircraft were deployed in EMS roles across 19 operators worldwide, showing that the type has also established a presence within key mission segment.

    Chart 3 shows that intermediate twin helicopters are expected to increase their share of total fleet over time. When considered alongside historical fleet development, this indicates that the segment’s growth is both established and expected to continue over the forecast period to 2034.  

    Chart 3: Forecast intermediate-twin helicopter fleet to 2034

    Source: 2025 Helicopter Fleet Forecast

    The expansion of intermediate twins over time reflects broader changes in how operators are selecting aircraft. In Europe in particular, intermediate twins have become increasingly prevalent in EMS operations following regulatory changes which amongst other things include the requirement of improved safety performance in the event of an engine failure. This has contributed to a shift from smaller platforms towards aircraft capable of meeting these requirements, supporting increased adoption of types such as the H145. As a result, replacements and upgrade activity have seen types such as the AW109 and H135 moving into secondary markets, particularly outside Europe, where requirements and mission profiles differ.

    From a value perspective, fleet scale and utilisation across multiple operators are key indicators of market depth. The H145 benefits from a larger installed base established operator network, supporting consistent levels of market activity and stable storage trends. The AW169, has demonstrated consistent fleet growth since entry into service and increasing deployment across multiple mission profiles, including EMS (28%), law enforcement (24%) and corporate use (20%). This diversification supports demand across different end markets and contributes to overall market stability.

    Leasing activity provides additional support to the segment. The 2025 Helicopter Fleet Forecast indicates that leasing activity has increasingly expanded into intermediate twin helicopters, with the segment accounting for approximately 15% of lessor focus in recent years. This reflects growing confidence in the long-term demand profile.  The missions supported by the H145/EC145 and AW169 are often long-term contracts, backed by governments providing favourable credit. Such structures provide predictable revenue streams and contribute to lower perceived asset risk, supporting value retention.

    Looking ahead, the increase in market share over the past decade suggests that intermediate twins are becoming an important part of the fleet mix. This is supported by their ability to operate across a range of missions while maintaining a cost profile that is lower than larger aircraft categories. At the same time, continued fleet growth, low storage levels and expanding leasing activity indicate that demand remains aligned with supply.

    Overall, the intermediate twin helicopter segment is supported by sustained fleet growth, increasing the share of total market value and continued expansion across core mission profiles. Aircraft such as the Leonardo AW169 and Airbus Helicopters H145/EC145 illustrate how fleet development, regulatory influences and market depth contribute to value behaviour. As the segment continues to mature, its increasing share of total market value combined with consistent fleet expansion and low storage levels, suggest that intermediate twins are likely to remain a core focus for both operators and lessors, supporting continued liquidity and stable value performance over the medium term.

  • Europe braces for severe jet fuel crunch before summer rush

    Shruti Salwan, Markets Editor, ICIS

    Jonathan Robins, Air Transport Reporter, Cirium

    Europe’s jet fuel supply is coming under mounting pressure as the loss of key Middle Eastern export flows, falling global refinery runs and depleted regional stocks collide with rising summer travel demand.

    With a sharp increase in prices already being felt, airlines are scrambling to respond. 

    No slack in the system

    The loss of supply from the Gulf — the single largest source of internationally traded jet fuel — has created a structural imbalance at a time when global inventories were already under strain.  

    According to the International Energy Agency’s (IEA) latest oil market report, global jet fuel demand averaged 7.8 million barrels/day in 2025, with 2 million barrels/day traded internationally.  

    Gulf exporters accounted for 400,000 barrels/day, around 20% of global trade, making them the single largest supply source. The loss of these flows has created a deep structural imbalance. 

    The supply tightness is set to worsen as refinery runs decline, with the IEA forecasting a one million barrels/day year-on-year decline in global crude runs in 2026, translating into 200,000 barrels/day lower jet supply versus pre-conflict levels. The impact could peak in the second quarter with up to 500,000 barrels/day removed from the market. 

    Europe in the firing line

    Europe remains particularly exposed as European OECD countries consumed 1.6 million barrels/day in 2025, with 500,000 barrels/day met via imports, highlighting the scale of the current supply shock.  

    According to ICIS Senior Analyst Man Yiu, “Europe’s monthly deficit of jet fuel averages over 2.5 million tonnes entering into the summer.”

    “Close to 60% of imports were sourced from the Middle East in 2025, majority of which comes through the Strait.” 

    Rising import dependence following post‑COVID refinery closures has further constrained Europe’s ability to absorb supply disruptions. 

    “Europe is under further pressure as it is likely to receive less volume from Asia. About 27% of imports were sourced from Asia, with India, South Korea, and China the key suppliers, all of which have cut refinery runs due to crude supply disruption and could restrict exports to prioritise local demand,” Man Yiu emphasised. 

    Source: ICIS Supply and Demand Database

    Market fundamentals have tightened rapidly as a result. European jet fuel prices more than doubled over a six‑week period from late February, with Northwest Europe cargoes reaching multi-year highs in early April as geopolitical tensions escalated.

    The prompt-month jet fuel crack spread — a measure of refinery margin — soared to the highs of $120/barrel during the period, reflecting the severity of the supply squeeze facing refiners and buyers alike. 

    While outright prices and cracks have moderated from recent peaks, the market continues to reflect underlying supply fragility, with inventories emerging as a key pressure point. 

    European jet fuel stocks at the major import-export Amsterdam-Rotterdam-Antwerp (ARA) hub have sunk to their lowest level since April 2020, according to Insights Global data, underscoring the speed of stock drawdowns as replacement flows struggle to keep pace. 

    The IEA has highlighted significant regional imbalances in jet fuel supply across Europe.  

    While some countries hold several months of stocks, major importers have less than 20 days of cover, with the UK — Europe’s largest jet fuel consumer and heavily import-dependent — particularly exposed due to tight inventories. 

    On the mainland, stocks appear sufficient for roughly 45–60 days, potentially extending supply through mid-May, but conditions are expected to tighten thereafter if flows do not normalise.  

    Arbitrage flows step up

    Efforts to offset reduced Middle Eastern supply through arbitrage flows have intensified, supported by rising exports from the USA and Nigeria. 

    US jet fuel exports reached a record 442,000 barrels/day in early April, with four-week averages up 200,000 barrels/day above seasonal norms, according to US Energy Information Administration (EIA) data cited by the IEA. 

    Similarly, Nigeria’s jet fuel exports have increased to 66,000 barrels/day, according to market participants, although the ultimate allocation of these volumes remains unclear. 

    As Europe approaches the peak summer travel season, the market is increasingly dependent on attracting these additional cargoes from alternative regions. However, competition for barrels remains intense, particularly as Asian refiners — also reliant on Middle Eastern crude — face their own supply constraints. 

    Market dynamics suggest a bifurcated structure, with supply risks likely to re-emerge into mid-May as inventories draw down and uncertainty surrounding Middle East flows intensifies while current supply buffers begin to diminish. 

    Airlines rush to reduce consumption

    On the demand side, early signs of adjustment are becoming more visible as airlines globally begin reducing capacity, particularly where fuel costs are unhedged or supply remains uncertain. 

    Germany-based airline group Lufthansa, for example, announced the permanent removal of 27 aircraft from its CityLine unit on 16 April, mostly MHIRJ CRJ models, as well as the retirement of its four-engined Airbus A340-600s. It will also ground some Boeing 747-400s from October 2026 ahead of the type’s retirement in 2027.

    This in many ways mirrors the approach taken by airlines during the pandemic, when older, less efficient aircraft were pulled out of service first, enabling carriers to minimise their costs.

    Lufthansa later went further, announcing on 21 April that it would drop 20,000 services over the summer with the ambition of saving around 40,000 tonnes of fuel. That’s despite its reassurances that it expects a “largely stable” fuel supply for the summer and is “pursuing a range of measures to this end”, such as hedging and physical purchases. It is however worth noting that for years, Lufthansa has complained about the difficulties of doing business in Germany and its desire to cut routes. Higher fuel prices could therefore present an ideal moment to do this.

    Meanwhile, US major carrier United Airlines has revealed plans to cut capacity by 5% in the second and third quarters of 2026 to mitigate fuel bills that now account for over 20% of its operating expenses. Chief executive Scott Kirby has warned that elevated jet fuel prices could cost it $11 billion extra over the course of the year.

    Yet United’s approach also highlights that — even in locations where shortages are not expected, such as the USA — it is the cost implications that are key. To that end, the carrier’s finance chief Michael Leskinen said during a 22 April results call that with the price of jet fuel rising “much more than the price of Brent”, he expected to see a “rationing function” in aviation as carriers pull back capacity. United alone spent $340 million more on fuel in the first quarter, which accounted for the vast bulk of a corresponding decline in profitability.

    Specifically, airlines are prioritising cuts on routes where passenger demand is too weak to absorb higher fuel charges and where margins are so thin that the connections do not make sense.

    KLM, operating in a market that is traditionally seen as price-sensitive, announced that it would operate 80 fewer flights in May 2026 to and from its Amsterdam Schiphol hub, specifically targeting high-frequency routes such as London and Dusseldorf where multiple daily flights can be consolidated.

    Meanwhile, Australia’s Qantas reduced its planned fourth-quarter domestic capacity by 5 percentage points, redeploying those aircraft to high-yield international routes like Paris and Rome to maximise revenue.

    Other, smaller players may see a more severe impact from surging fuel prices. Norse Atlantic, a low-cost long-haul carrier which launched amid the pandemic, and which crucially does not hedge its fuel, said on 15 April that it would restructure its operations and raise $110 million from shareholders in a bid to ride out elevated kerosene prices. Its stock price immediately halved on the news, with scant recovery since.

    Unsurprisingly, the Middle East has been at the centre of capacity reductions globally. Air traffic manager Eurocontrol notes that in the week of 6-12 April, flows from Europe to the region were down 54% on last year, although overall capacity in Europe continued expanding as airlines ramped up into the peak season. The number of flights rose 2% week on week but remained slightly below 2025 levels, although this also reflected the impact of a pilot strike at Lufthansa. 

    A drop in the jet fuel ocean?

    Despite such adjustments, there is a broad consensus among participants in the jet fuel market that demand-side responses have not yet reached the scale required to offset the structural supply shortfall. 

    Traders note that while reduced flight activity does lead to a marginal decline in jet fuel demand, the impact remains relatively limited in scale and timing.  

    Airline consumption tends to adjust gradually rather than abruptly, meaning demand-side softness has not been enough to materially rebalance the market. 

    At the same time, ongoing disruptions in supply chains, combined with particularly reduced or redirected refinery and trade flows, have removed a more significant volume of barrels from the system.  

    This imbalance between only modest demand erosion and more pronounced supply constraints has left overall fundamentals skewed tight, with the market continuing to rely heavily on constrained inventories and volatile import flows rather than meaningful demand relief. 

    This is despite the signals showing that strategic cuts to capacity are more than just a few isolated airlines marking cosmetic changes, but a global shift. Cirium data indicates that airline capacity for May 2026 has fallen by around 3 percentage points, with 19 of the world’s 20 largest airlines cutting flights. The longer the crisis goes on, the more cuts should be expected.

    Gaps in the market

    At the same time, some airlines are also spotting opportunities that could even increase their jet fuel use.

    With the suitability of the Middle East as a transfer hub now called into question, European airline groups IAG, Air France-KLM, and Lufthansa Group have rapidly ramped up their direct services to Asia, often using equipment that would have been operated to the Gulf. India has proved particularly popular, with all three groups adding significant capacity to the country.

    Speaking in March, Casten Spohr, Lufthansa Group’s chief executive, said that extra flights placed into Asian routes had been “filled within days” by customers that would have transferred through the Middle East. Over the longer term, he expects his airlines’ reputations as “pillars of stability” to serve as a tailwind, given that passengers tend to respond to geopolitical upheaval by choosing established brands flying to destinations perceived as low-risk. Given this, “we can certainly attract more customers and make more profits,” he said.


    ICIS is a global provider of independent commodity intelligence for the chemicals and energy markets. Cirium is the world’s most trusted source of aviation analytics, providing data and analytics to the air transport industry. ICIS and Cirium are both part of LexisNexis® Risk Solutions, a RELX business.

  • March 2026 – Southeast Asia On-Time Performance Monthly Report

    March 2026

    Amid a 72% surge in flight cancellations across Asia-Pacific, airline performance in Southeast Asia remained mixed. Some carriers improved On-Time Performance by up to 15 points, demonstrating greater operational resilience, while others recorded declines of nearly 3 points.

    Singapore Airlines emerged as the region’s top performer, improving OTP by 10 points and surpassing Garuda Indonesia, which posted a 2-point decline.

    Download the March 2026 Southeast Asia On-Time Performance Report

    When you submit the form, you will be redirected to the latest Southeast Asia Monthly On-Time Performance Report. You will also receive an email with a link to the report for future reference.

    SUBSCRIBE to be the first to hear about new Cirium reports and analyses.

    February 2026

    A 40% reduction in flight cancellations across Asia-Pacific helped Garuda Indonesia rise as the region’s On-Time Performance leader, reinforcing its position as one of the top-performing airlines in the market. Meanwhile, Singapore Airlines and Philippine Airlines remained among the most reliable carriers in Southeast Asia, despite month-on-month declines in on-time performance that point to increasing operational challenges, shifting airline performance trends, and evolving aviation reliability dynamics across the region.

    January 2026

    A 19% decline in flight cancellations in the Asia-Pacific market has directly contributed to improved schedule integrity across Southeast Asian carriers. Analysis of operational data shows that decreased disruption rates allowed airlines to achieve up to a six‑point increase in On‑Time Performance. This performance shift has also resulted in a reordering of OTP rankings, with a new leader emerging due to more efficient turnaround processes, reduced ground delays, and optimized fleet utilization.

    November 2025

    While widespread flight cancellations plague the aviation industry, Southeast Asian carriers are not just surviving—they’re thriving. Philippine Airlines (PAL) successfully defended its crown as the regional leader for the fourth consecutive month, delivering an impressive 84.67% OTP. Making the biggest move this period, Garuda Indonesia pulled off a massive upset. The carrier leaped from sixth to second place in the rankings after a sharp, decisive boost in its On-Time Performance.


    Southeast Asia On-time performance airline reports

    2026

    Southeast Asia On-time performance airlines reports

    2025

    Southeast Asia On-time performance airlines reports

    2024

    Southeast Asia On-time performance airlines reports

    2023

    Southeast Asia On-time performance airlines reports

    Learn more about Cirium On-Time Performance and download 2025 Reports, here.

  • Philippine Airlines — Asia Pacific’s Rising Star

    Mike Malik, Chief Industry Officer, Cirium

    Sometimes the best stories in aviation are the ones nobody sees coming.

    On March 19th, I presented the Cirium On-Time Performance Award for the Most On-Time Airline in Asia Pacific to Philippine Airlines in Manila. Two thousand employees filled the room. The event was televised to those who couldn’t attend. The airline was celebrating its 85th anniversary and chose that milestone to also celebrate something earned in real time, an operational performance that put it ahead of every other carrier in the region. When the results hit the screen, the room erupted. Having run Cirium’s OTP program for the past seven years, a program now in its 17th year as the industry standard, I have stood in front of airline teams around the world. Few moments have matched that one.

    The data tells the story. In 2022, Philippine Airlines did not place among Cirium’s top ten most punctual airlines in the Asia‑Pacific region. By 2023, PAL entered the rankings at eighth place, and rose further to seventh in 2024. In 2025, that trajectory culminated in a number one ranking, with an on-time performance of 83.12 percent. Improvements of that magnitude do not happen by chance. September 2025 hit 90.47%. PAL claimed first in the regional rankings four times: April, August, September, and October. That is not a hot streak. It is the result of consistent operational performance, built on a foundation established over three years.

    In every top-performing airline I have studied, the pattern holds. It starts with a commitment from the management team that the airline will be an on-time airline. It requires strong relationships with operational partners. And it demands continued investment in equipment, training, and analytics. But the airlines that sustain it share something deeper: a culture where reliability is not a goal but a standard, where it is measured, owned, and part of how every team operates.

    Richard Nuttall, President, Philippine Airlines

    What makes this personal is the man now leading the airline. Richard Nuttall became PAL’s president in May 2025, the first foreign national to hold the post in the carrier’s history. Richard and I go back to our time at Cathay Pacific Airways in Hong Kong, where I was an embedded consultant from Sabre helping the airline implement crew scheduling, revenue management, and flight and operations control systems. His career since has taken him across five continents, through leadership roles at Kenya Airways, Royal Jordanian, Saudia, as CEO of Bahrain Air, and most recently as CEO of Sri Lankan Airlines, where he steered the carrier back to profitability. What connects all of it is a consistent ability to walk into difficult situations and get the operation running right. After the ceremony, Richard told me this was just the start, that the airline has enormous potential still to unlock.

    Lucio Tan III, President and COO, LT Group, Inc and PAL Holdings, Inc

    That momentum is now being carried forward by a leadership team guiding Philippine Airlines’ path ahead.  Lucio Tan III, the Stanford‑educated grandson of patriarch Dr. Lucio C. Tan, serves as President of PAL Holdings. Bringing in someone with Nuttall’s international track record alongside next‑generation ownership signals a group that knows where it wants to go. Carlos Luis Fernandez rounds out the team as EVP / COO.


    The fleet strategy fits. PAL took delivery of its first Airbus A350-1000 in December, the first in Southeast Asia, with eight more arriving through 2027. New aircraft are easier to keep on schedule, and fleet renewal at this scale reinforces the operational gains that drove the OTP results.

    Lucio Tan III, President and COO, LT Group, Inc and PAL Holdings, Inc

    Every on-time arrival is a promise kept. Philippine Airlines kept that promise more consistently than any airline in Asia Pacific last year. The leadership is in place, the fleet is arriving, and the culture is delivering. This is an airline that has earned the right to be taken seriously.

  • How higher jet fuel prices are reshaping airline capacity plans

    Cirium Ascend Consultancy is trusted by clients across the aviation industry to provide accurate, timely, and insightful aircraft appraisals. The team provides the valuations and analysis the industry relies on to understand the market outlook, evaluate risks and identify opportunities.

    Discover the team’s industry reports & market commentaries. Read their latest expert analysis, viewpoints and updates on Thought Cloud.

    Richard Evans airline consultant
    Richard Evans airline consultant
    Richard Evans – Senior Aviation Analyst, Cirium

    Team Perspective

    Richard Evans, Senior Consultant, Cirium Ascend Consultancy

    Three weeks ago, Cirium’s forward schedule data for April 2026 showed a 3.4% year-on-year growth in ASKs, compared to 5.4% immediately before the conflict started. For May 2026, planned capacity had fallen marginally, from 6.6% to 6.3%.

    Since then, airlines have continued to adjust their near-term schedules, as a direct result of airspace and airport disruption in the Middle East, as well as due to the cost impact of a doubling in jet fuel prices. The latest schedule data now shows that April 2026 ASKs are down by 2.0% year-on-year, in-line with the March 2026 actual flown capacity. May 2026 capacity has now been cut by around three percentage points, to stand at 3.4% growth over May 2025. 

    The chart below shows the latest May 2026 capacity plans of the 20 largest airlines, in terms of ASKs. With one exception, Turkish Airlines, all the airlines have cut their May schedule. Most have made reductions of 0-5 percentage points, consistent with the global change of 3%. There is a noticeable contrast between Qatar, with schedule now down 33% versus May 2025, and Emirates, who still plan a 2.4% year-on-year growth.

    All regions have seen schedule cuts, with major airlines in North America, Europe and Asia Pacific reacting to a similar degree. The two purely short-haul carriers in this sample, Southwest and Ryanair appear to have been impacted less, making cuts of less than 1% at present.

    It appears extremely likely that more reductions are ahead. Delta guided to flat year-on-year capacity in Q2 2026, against its current plan of 2.7% growth and Ryanair hinted it might trim schedules by 5-10% if jet fuel prices remain at their current levels.

    Planned capacity for May 2026 – largest airlines

    Source: Cirium schedules data, Cirium Ascend Consultancy analysis

    Turning to the 100 largest carriers, those with the biggest reductions in planned capacity unsurprisingly have several from the Middle East at the top of the list. However, there are airlines from a wide variety of countries represented in the data. Southeast Asian carriers appear to have been greatly impacted, consistent with media reports of fuel supply shortages in Vietnam and Philippines. Airlines from Malaysia and Indonesia have also cut planned schedules by around 10-15%. Some smaller Chinese airlines are also included, such as Sichuan Airlines and Xiamen Airlines.

    Some of these airlines were planning on very large capacity expansions, and their latest schedules still imply year-on-year growth of 5% or more. Nevertheless, the list appears to show particular impact for  some of the LCC carriers in Asia and the Americas.

    Planned capacity for May 2026 – biggest schedule reductions

    Source: Cirium schedules data, Cirium Ascend Consultancy analysis, Top 100 airlines by Jan 2025 ASKs

    With the Iran conflict not fully resolved, it is clear that 2026 will experience a significant slowing of traffic and capacity, compared to Cirium Ascend Consultancy’s initial prediction of 4-6% growth over 2025. The impact will clearly be both deeper and more prolonged the longer the conflict continues and the longer jet fuel prices remain at their current levels, with second-order economic effects and risks increasing.

    We have constructed some initial scenarios to estimate the global impact on the aviation market, which have been shared in more detail to our Commercial Aviation Monitor clients, and at industry events. These are based on modelling month-by-month capacity profiles for each airline domicile region, in the same way we considered the impact and recovery from Covid-19. The scenarios produce a range of outcomes, with 2026 global capacity change ranging from a decline of 2-3% to growth of 1-3%.

    The more severe scenarios will require airlines to take additional action. Older, less fuel-efficient aircraft are the most likely to see utilisation cuts or parking. Airlines will seek to preserve cash in such circumstances, implying maintenance deferrals and fewer lease extensions. New aircraft deliveries appear less vulnerable, given the obvious fuel savings they deliver, but airframers themselves may face additional supply chain issues. Cirium will cover all these issues and more over the coming months.

  • Scoot, Qatar, and Ryanair top Cirium global airline emissions rankings in 2025

    • Scoot, the Singapore-based low-cost carrier, claimed the top spot in Cirium’s 2025 EmeraldSky Annual Review.
    • Qatar Airways, Ryanair, and Turkish Airlines recognized as most efficient global airlines when ranked by seat capacity.
    • Regional leaders include Frontier (Intra-North America), Wizz Air (Europe), Virgin Atlantic (Transatlantic), Air Canada (Transpacific), JetSmart (Latin America), and Vietjet (Asia).

    LONDON (Apr. 15, 2026) – Singapore-based Scoot has been named the world’s most emissions-efficient airline in Cirium’s 2025 EmeraldSky Annual Review, taking the top position from last year’s leader, Wizz Air. Qatar Airways, Ryanair, and Turkish Airlines were each recognized as the top three most efficient global airlines, ranked by available seat kilometres (ASK).  

    Cirium’s industry leading ranking is based on CO₂ per available ASK across the world’s 100 largest airlines. The methodology is independently assured by PwC to ISAE 3000. It groups airlines into Gold, Silver and Bronze tiers based on global performance, which covers the top 15 airlines as well as key regional and route performers.

    “Airline emissions performance comes down to decisions airlines can control — fleet choices, seat configuration and how aircraft are deployed on routes,” said Jeremy Bowen, CEO of Cirium. “The airlines at the top of these rankings have got those fundamentals right, and it shows. Better emissions efficiency and lower fuel bills go hand in hand.”

    Scoot is the first Southeast Asian carrier to lead in global airline emissions efficiency rankings. Its average seat density of 242 seats per aircraft, operating on longer average sectors, placed it in the lead position this year. The results reinforce a consistent pattern across the industry. Airlines operating younger fleets with higher seat density continue to outperform their peers on emissions efficiency, with low-cost carriers dominating the top of the rankings. Wizz Air placed second (after placing first in 2024), followed by TUI Airways, Air Europa and Frontier Airlines, with all five carriers ranking in the top five globally and earning Gold status. Each has young fleets of aircraft compared to their peers.

    RankAirlineBase CountryPAX CO2/ASK (g)CO2 emissions (mt)Flights per Year (thousands)Fleet Age (years)Avg. distance (km)
    1ScootSingapore512.0656.72,157
    2Wizz AirHungary52.96.23354.71,547
    3TUI AirwaysUK53.62.2669.72,862
    4Air EuropaSpain53.92.169102,023
    5Frontier AirlinesUSA54.13.52084.81,470
    6TUIflyGermany54.41.65810.62,475
    7Virgin AtlanticUK54.52.8276.86,566
    8AirAsia XMalaysia54.81.620144,177
    9PegasusTurkey55.93.823351,372
    10JetstarAustralia563.718311.11,623
    11CondorGermany56.152.295511.22,883
    12Spirit AirlinesUSA56.773.782176.41,535
    13IberiaSpain57.034.4710011.52,831
    14VolarisMexico57.333.101807.51,532
    15IndiGoIndia57.369.847964.21,082

    *Gold: Ranks 1-5 | Silver: Ranks 6-10 | Bronze: Ranks 11-15. For the full list of 20 airlines, please reference the report.

    Wizz Air remains among the strongest performers with a fleet averaging under five years, similar to other performers such as Frontier Airlines and IndiGo.

    Long-haul operators, in contrast, are closing the gap primarily through fleet renewal, by removing from service older, less-fuel-efficient aircraft. Airlines such as Virgin Atlantic demonstrate that newer widebody aircraft and higher-capacity configurations can deliver competitive emissions performance even on long-distance routes.

    Top Airlines by ASK

    The table below reflects the top three most efficient global airlines, ranked by available seat kilometres (ASK). The top 10 global airlines as ranked by ASK, are listed in the full report. 

    RankAirlineBase CountryPAX CO2/ASK (g)CO2 emissions (mt)Flights per Year (thousands)Fleet Age (years)Avg. distance (km)
    1Qatar AirwaysQatar60.015.419810.24,221
    2RyanairIreland62.717.4114810.11,264
    3Turkish AirlinesTürkiye64.215.84289.72,332

    Regional and Key Intra Regional Rankings

    The table below reflects regional rankings, as well as for well-trafficked corridors, the Transatlantic and Transpacific. Across every region, airlines with younger fleets and higher seat density continue to lead within their markets. Results in each region carry their own story as metrics of comparison change.

    RankAirlineBase CountryPAX CO2/ASK (g)CO2 Emissions (mt)Flights (000s)Fleet Age (yrs)Avg. Dist. (km)
    Intra-North America
    1Frontier AirlinesUSA54.53.01854.81,402
    2Spirit AirlinesUSA57.43.11856.51,463
    3WestJetCanada67.02.417511.51,348
    Europe
    1Wizz AirHungary53.13.92224.61,462
    2Jet2UK57.92.811013.62,206
    3TransaviaNetherlands59.92.011610.51,491
    Southeast Asia
    1VietJet AirVietnam64.51.41078.2941
    2Singapore AirlinesSingapore66.70.90455.91,181
    3Lion AirIndonesia67.11.190.013.3828
    Latin America
    1JetSmartChile57.91.192.03.11,033
    2VolarisMexico58.82.01377.61,297
    3VivaAerobusMexico61.42.11579.11,069
    Transatlantic
    1Virgin AtlanticUK53.71.816.96.56,759
    2Air CanadaCanada54.92.724.414.46,108
    3Aer LingusIreland56.21.215.19.05,793
    Transpacific
    1Air CanadaCanada56.21.68.910.210,178
    2Delta Air LinesUSA57.51.911.36.19,945
    3Cathay PacificChina59.82.510.89.011,933

    Airlines Closing the Gap: Capacity Growth Without Emissions Growth

    Cirium’s 2025 review shows whether airlines are growing capacity faster than emissions. The table below ranks individual routes by the largest year-on-year reductions in CO2 per ASK and identifies the specific aircraft transition that drove each result. To qualify, a route must have operated at least 300 round trips in the year.

    The metric highlights carriers making measurable progress, not just those already operating efficient fleets. Korean Air recorded the largest long-haul route improvements globally, driven by the transition to next-generation aircraft on key transpacific routes.

    RankRouteCarrierYoY CO₂/ASK ImprovementCO₂/ASK 2025 (g)Fleet TransitionAvg. SeatsRoute Dist. (km)
    1ICN – SEAKorean Air-27.4%53.6777-300ERs → 787-9/10s3088,376
    2ICN – HNLKorean Air-22.4%52.3747-8s & 777-300ERs → 787-10s3277,354
    3JFK – DELAmerican Airlines-20.4%59.8777-300ERs → 787-9s28511,756
    4KEF – SEAIcelandair-20.3%57.9757-200s → A321neos1865,810
    5JFK – GRUAmerican Airlines-19.3%51.5777-200ERs → 787-9s2847,663
    6LHR – HKGBritish Airways-18.1%64.3777/787 family → A350-1000s3039,631
    7BOS – LHRDelta Air Lines-17.0%60.0A330-200s → A330-900neos2685,241
    8MSP – LHRDelta Air Lines-16.9%57.2A330-200s → A330-900neos2816,443
    9MUC – BOMLufthansa-16.4%55.5A340-600s → A350-900neos2936,312
    10HKG – CDGCathay Pacific-16.4%62.8777-300ERs → A350-900neos2879,590

    “The route-level data tells a clear story,” said Bowen. “When airlines swap older widebodies for next-generation aircraft, emissions per seat kilometre can fall by as much as 27 percent on that route within a year. This isn’t theoretical — we’re measuring it on real routes with real operational data.”

    About the EmeraldSky emissions report

    Now in its second year, Cirium’s EmeraldSky Annual Review evaluates airline emissions intensity using CO₂ per available seat kilometre (ASK), based on analysis of the world’s 100 largest scheduled passenger airlines.

    The 2025 edition also tracks year-on-year progress, measuring whether airlines are increasing capacity faster than emissions. The methodology uses flight-level operational data and is independently assured under ISAE 3000 by PwC. EmeraldSky is also accredited by the Rocky Mountain Institute as a qualified flight emissions data provider under the Pegasus Guidelines, the first climate-aligned finance framework for aviation.

    For more information, visit cirium.com or follow Cirium on LinkedIn.

    For Cirium media inquiries please contact media@cirium.com

  • The Immediate and Current Impacts to Middle East Hub Airports and Airlines

    The Middle East Carriers Connect Continents

    The Middle Eastern carriers and hubs are critical for long-haul passengers. The 2026 Middle East conflict has directly impacted intercontinental airline connectivity, and in particular, between Europe, Asia, and Australasia.

    For instance, Cirium has analysed passenger share between continents, comparing 30 global international airlines. Emirates alone carries over 13% of Europe-to-Asia passengers and more than 31% between Europe and Australasia. Qatar Airways and Etihad further reinforce this concentration, meaning that on some of the world’s longest and most transfer-dependent routes, a small number of Gulf carriers collectively control a significant portion of capacity and passenger traffic.

    5M Disrupted Passengers in the Early Weeks of the Conflict

    A weeks-long conflict has disrupted the travel plans of leisure and business travelers alike. Our rough estimate suggests that around 5 million passengers were impacted by flight cancellations between February 28 and March 11, 2026 — though this remains a high-level approximation covering cancellations between the Middle East and destinations outside the region, excluding intra-Middle East flights. The estimate assumes an average load factor of 80% and roughly 242 seats per flight, recognizing that capacity varies significantly by aircraft type and route. 

    The Immediate Impact: Cancellations Peaked and a Return to (Semi) Normalcy

    An Initial Shock

    When the conflict began, Cirium data showed an immediate and severe shock to Middle East departures at the onset, tempered by a steady normalization. For instance, on February 28, around 37% of flights were cancelled or did not operate, but within the first days of the conflict, cancellation rates peaked above 65%, with more than 2,300 daily departures grounded. This early phase reflected a near-system-wide disruption, where airlines and airspace constraints combined to remove well over half of scheduled flying across the region.

    Slow and Steady Recovery

    From mid-March onward, a clear recovery trend emerged. Cancellation rates decline consistently week by week, falling into the 20-30% range, then into the teens by early April. As of April 6, the latest data we’ve analyzed at the time of writing, cancellations have dropped below 10-11%, with total daily cancellations under 250 flights. The region has moved from acute shock to gradual stabilization, with the exception of non-Middle Eastern carriers, who have generally not resumed service.  

    The table below reflects the cancellations or no-flies (flights that didn’t operate but were not officially canceled, from the Middle East, from February 28, 2026 to April 6, 2026):

    DateFlights ScheduledCancelled or No FlyCancelled or No Fly %
    2026-02-283,7591,39537.11%
    2026-03-013,8302,50465.38%
    2026-03-023,5842,33065.01%
    2026-03-033,5602,34165.76%
    2026-03-043,6632,23861.10%
    2026-03-053,7982,17857.35%
    2026-03-063,6462,07356.86%
    2026-03-073,5031,87153.41%
    2026-03-083,5722,02056.55%
    2026-03-093,3221,59147.89%
    2026-03-103,1991,45845.58%
    2026-03-113,3901,67149.29%
    2026-03-123,2421,50846.51%
    2026-03-132,9531,20040.64%
    2026-03-142,9871,17339.27%
    2026-03-152,67183531.26%
    2026-03-162,55086433.88%
    2026-03-172,67891033.98%
    2026-03-182,8981,00034.51%
    2026-03-192,60868626.30%
    2026-03-202,49355722.34%
    2026-03-212,56550319.61%
    2026-03-222,61555421.19%
    2026-03-232,45242417.29%
    2026-03-242,45944818.22%
    2026-03-252,50947318.85%
    2026-03-262,50843817.46%
    2026-03-272,44242217.28%
    2026-03-282,48935614.30%
    2026-03-292,31124210.47%
    2026-03-302,29127011.79%
    2026-03-312,2252139.57%
    2026-04-012,44331112.73%
    2026-04-022,43428311.63%
    2026-04-032,32327011.62%
    2026-04-042,3712118.90%
    2026-04-052,3131898.17%
    2026-04-062,27324710.87%

    Impacted Airports in the Middle East

    The impact of the conflict varies sharply by airport, with a divide between disrupted regional airports  and slightly more resilient global hubs. The largest hubs, Dubai (DXB) and Abu Dhabi (AUH), maintained cancellation rates around 48-50%. In ordinary times, that counts as a severe disruption. However, Doha International Airport (DOH) had nearly 80% of its operations impacted. Tel Aviv (TLV) experienced extremely high disruption (around 86%), reflecting direct exposure to bombing threat.

    The Airlines Adapt

    On the part of the airlines, Qatar Airways saw very high disruption at around 77%, significantly worse than its competitors Emirates and Etihad, at 32% and 49% respectively.

    Among major international carriers, the U.S. and European airlines halted operations aggressively: Major carriers including Delta Air Lines, United, American, and Air Canada have suspended operations. Carriers such as British Airways and Lufthansa maintained partial operations where operationally feasible. It is not possible to predict a return to normal operating schedules at this point. That lays squarely in the domain of the airlines themselves.

    Schedule Reductions

    The three major Gulf carriers (Emirates, Qatar Airways, and Etihad) have drastically cut April capacity versus the pre-conflict schedule. In total, they have removed more than 5.4M seats and more than 18,000 flights for the month of April alone. The trend is likely to continue in the near term.

    The table below shows recent changes on major city-pairs.

    AirlineCity PairPre-Conflict (Feb 27 snapshot)Post-Conflict Flight Reductions (Apr 1 snapshot)
    EmiratesDubai – SingaporeHigh-frequency widebody (28+ weekly)−15% to −25%
    EmiratesDubai – London HeathrowVery high frequency−5% to −10%
    Qatar AirwaysDoha – BangkokHigh-frequency−20% to −35%
    Qatar AirwaysDoha – Paris CDGDaily / multi-daily−5% to −15%
    EtihadAbu Dhabi – SydneyDaily long-haul−30% to −40%
    EtihadAbu Dhabi – New York JFKDaily−10% to −20%
    EmiratesDubai – New York JFKMultiple daily A380/777−10% to −20%
    Qatar AirwaysDoha – Kuala LumpurHigh-frequency−20% to −30%
    EmiratesDubai – MelbourneHigh-capacity long-haul−25% to −35%
    EtihadAbu Dhabi – London HeathrowMultiple daily−5% to −10%

    Unlock the power of Cirium’s data and analytics to optimize your operations and stay ahead in a rapidly changing aviation landscape. Contact us to find out more.

    For Cirium media inquiries please contact media@cirium.com

  • A330-300 Retrofit Trends: Bridging the Delivery Gap

    Cirium is proud to be the Official Data Analytics Partner of Aircraft Interiors Expo 2026

    James Mellon, Senior Aviation Data Research Analyst, Cirium

    Airbus A330-300s make up 13% of the widebodies operating passenger flights, with 602 examples in service. That equates to 77% of the 777 A330-300s built over 28 years between 1992 and 2020.

    Given that new widebodies are being delivered at a relatively glacial pace amid OEM ramp-up issues, the reliance on keeping older aircraft in service for even longer will increase as the decade continues. In February 2026, Cirium Ascend Consultancy noted that market values for the A330-300 had increased 20% since January 2025, while market lease rates were up 15%.

    The outlook appears to brighter for the -300 than for its smaller sibling the -200. Just 6% of the passenger -300 fleet is stored, compared with 21% of the -200’s. The average age of the in-service passenger -300s is 14 years old. The 271 in-service passenger -200s have an average age of 16.

    The increasing value of the A330-300 makes it a more worthwhile investment prospect, as it appears that many will remain operational well into the next decade.

    In my analysis, I look at some of the airlines that have retrofitted their fleets of A330-300s over the past few years, and other airlines planning to update theirs soon.

    Past Airbus A330-300 Retrofits

    Cirium Ascend Ground Events data indicates that 57 Airbus A330-300s have been retrofitted with new cabins since March 2020.

    Source: Cirium Ascend Ground Events, retrofit events commencing between March 1, 2020 – March 9, 2026.

    Airlines’ ability to retrofit aircraft hinges on multiple factors, so installing the right interior products at the time of acquiring second-hand aircraft isn’t always possible.

    Since 2019, Air Canada’s fleet of eight A330-300s has been supplemented with 12 second-hand examples, all originating from Singapore Airlines. Air Canada has operated the ex-SIA units for a long period with their inherited 285 seat dual-class configuration, prior to their being retrofitted with new business-class seats while premium-economy cabins were added. Ground Events data shows that 18 aircraft in the fleet have been retrofitted at four different locations across the USA, Hong Kong and Singapore.

    Ground Events data shows that Delta Air Lines’ entire fleet of 31 A330-300s was retrofitted over a two-year period between May 2021 and May 2023, when premium-economy cabins were installed. Collins Aerospace MiQ seats were added when 24 aircraft visited Aeroman in El Salvador. The other seven were retrofitted in-house by Delta TechOps at Minneapolis-Saint Paul.

    Between 2021 and 2024, Finnair had its entire widebody fleet of A350-900s and A330-300s, totalling 26 aircraft, refreshed with the installation of new cabin products. The brand-new Airlounge seat from Collins Aerospace was central to the airline’s new business-class product, while premium economy was introduced and HAECO Vector seats debuted. Ground Events data shows that seven A330-300s were retrofitted by HAECO in Hong Kong between 2021 and 2023, while the eighth aircraft was updated a year later, during the second quarter of 2024, by Sabena Technics in Bordeaux, France.

    Future Airbus A330-300 Retrofits

    Several airlines have publicly announced plans to retrofit their fleets of A330-300s over the next few years, in some cases as a bridge to the delivery of brand-new replacements. In most cases, the upgrades will be focused on the premium cabins.

    Following the recent installation of premium-economy cabins, Delta Air Lines’ latest business-class offering, the ‘Delta One’ suites, will also be retrofitted onto its oldest A330s. Cirium Ascend Fleets Analyzer shows that the average age of Delta’s A330-300s is 17 years, but this is skewed by the 21 Pratt & Whitney-powered aircraft that have an average age of 20 years old. Originally delivered between 2003 and 2007, to Northwest Airlines, the aircraft were acquired through that carrier’s merger with Delta in 2008.

    Delta’s other widebody fleets featuring Delta One suites have Thompson Aero Seating Vantage and Vantage XL seats, from a mix of line-fit and retrofit installations.

    It is not yet clear which MRO facility the A330-300s will visit, but Ground Events data shows that ST Engineering Aerospace recently retrofitted nine Delta A350-900s at its Paya Lebar location in Singapore, while all 21 Boeing 767-400ERs were retrofitted at Guangzhou, China.

    Cathay Pacific also plans to refresh its A330-300s, with 20 set to undergo retrofit work starting in late 2026. Fleets Analyzer shows that of Cathay Pacific’s 43 A330-300s, 23 were manufactured between 2010 and 2015, and the other 20 between 2001 and 2007. The new ‘Aria Studio’ business-class product will be introduced alongside improvements to the economy and premium-economy cabins. Cathay’s A330-300s currently feature six different cabin configurations, per Fleets Analyzer. This retrofit project will allow the rejuvenated aircraft to be streamlined into one seat configuration.

    This work is starting prior to the arrival of Cathay Pacific’s first A330neo. Fleets Analyzer shows that the airline has ordered 30 A330-900s and taken options on 30 more, with deliveries due from 2028.

    The popularity of premium economy continues, with various airlines rolling the cabin out across their whole widebody fleets. Premium-economy cabins are being added to Swiss’s A330-300s, following the introduction in 2022 of the new cabin class on board its Boeing 777-300ERs. The retrofit of its 14 A330-300s will also add new cabin products, to match the brand-new A350-900s currently joining the fleet. Premium-economy seats manufactured by ZIM will sit alongside overhauled first, business and economy cabins with new seats and suites supplied by Collins, Stelia and Recaro, respectively.

    In addition to Swiss, other Lufthansa Group airlines will also update their A330-300s in the coming years. Leisure-focused Discover Airlines is planning nose-to-tail upgrades, including new wi-fi from Starlink, as part of a group-wide deal to equip around 850 aircraft. Discover will also expand its fleet to 16 A330-300s, benefiting from the fleet rationalisation that Lufthansa Group is undertaking. Fleets Analyzer shows that the seven remaining Lufthansa A330-300s are all scheduled to be transferred in 2026-27, with five aircraft moving to Discover and the other two to Brussels Airlines. The Belgian carrier will also overhaul its fleet of A330-300s, upgrading all three cabins.

    The Chinese Market’s Potential

    Looking at the current in-service fleet, 20% of A330-300s are operated by airlines based in China. It appears that these aircraft have not undergone any significant alterations to their original interiors since delivery.

    Fleets Analyzer shows that nine Chinese airlines operate 120 of the aircraft with an average age of 10.5 years old. Cirium Ascend Consultancy and other industry observers note that China has a dearth of widebody aircraft orders, relative to the size of the current in-service fleet that will need replacing in the coming years.

    Fleets Analyzer shows that 41 widebody passenger aircraft are currently on order or under LOI for Chinese airlines. It is likely that some of the nation’s carriers will receive widebodies ordered by lessors.

     The increasing value of the A330-300

    Despite airlines’ rebuilding of their long-haul networks to pre-pandemic scale, the rate at which new widebodies are being delivered that can operate these routes remains be significantly lower than the 2010s. As evidenced by the examples above, airlines are investing in their legacy widebody fleets by retrofitting them with new interiors to extend their service lives before any brand-new replacement aircraft will be delivered.


    Cirium provides aircraft OEMs, MRO and the aftermarket with independent aircraft intelligence, enabling them to reduce downtime, manage risk and act before the market moves. Discover more

    Attending Aircraft Interiors Expo in Hamburg? Don’t miss Andrew Doyle present an in-depth analysis of fleet and market trends at CabinSpace Live alongside Gary Weissel, Managing Officer at Tronos Aviation Consulting, Wednesday 14 April from 09:30. Find out more and connect with the Cirium team

  • The helicopter market: from volatility to maturing resilience

    Cirium Ascend Consultancy is trusted by clients across the aviation industry to provide accurate, timely, and insightful aircraft appraisals. The team provides the valuations and analysis the industry relies on to understand the market outlook, evaluate risks and identify opportunities.

    Discover the team’s industry reports & market commentaries. Read their latest expert analysis, viewpoints and updates on Thought Cloud.

    Team Perspective

    Sara Dhariwal, Lead Appraiser – Helicopter & AAM Markets , Cirium Ascend Consultancy

    Last week’s Cirium Ascend Consultancy helicopter market webinar examined the key forces shaping today’s rotorcraft market, from fleet growth and replacement cycles to civil‑military production dynamics, oil pricing and delivery trends.

    After more than a decade of disruption, the market is showing clear signs of maturity. Long asset lives, disciplined deliveries and an ageing global fleet are supporting stability today, while also underpinning future replacement demand.

    Reflecting this shift, Sarah Johnston, In‑House Counsel at SMFL Helicopters, noted that increased stability and a growing number of market participants represent “a very positive development” for the sector. Gabriella Oliveira del Mastro, Fleet Director at PHI, similarly observed that greater stability reflects a more deliberate and mature market approach.

    Steady fleet growth, shaped by longevity

    Over the past decade, the global civil helicopter fleet has grown at an average rate of around 1.5% per year. Growth slowed briefly in 2020 as the pandemic disrupted deliveries, but has since recovered, with expansion closer to 2% annually in recent years. By the end of 2025, the global fleet reached approximately 24,500 helicopters, representing a net increase of just over 3,200 aircraft.

    Fleet growth has been supported less by elevated deliveries and more by persistently low exit rates, with retirements and total losses averaging just over 1% per year. Longevity remains a defining feature of the market, with around 90% of helicopters delivered over the past 30 years still in operation and the average retirement age approaching 40 years. While this durability underpins asset values, it has also resulted in a steadily ageing global fleet.

    Replacement demand is building — but slowly

    Looking ahead, replacement rather than fleet expansion is expected to be the primary driver of helicopter demand. Cirium estimates that just over 4,000 helicopters could require replacement over the next decade — equivalent to around 70% of the current global fleet. While elevated asset longevity and OEM production constraints have delayed replacement activity, they have also helped restrict supply and support asset values.

    As the market evolves, a more mature secondary ecosystem is beginning to form. del Mastro noted that the helicopter sector is starting to adopt attributes long established in fixed‑wing aviation, including structured part‑out activity and lifecycle management. Echoing this, Johnston highlighted the need for stronger and more formalised secondary‑market support, underscoring the role this will play in enhancing capital efficiency and long‑term value preservation.

    Civil and military demand: competition for capacity?

    A recurring question is whether rising military demand is constraining deliveries into the civil helicopter market. Civil and military variants often share production lines and supply chains, making this a valid concern given the current geopolitical environment.

    Historical data suggests OEMs have generally balanced production across both segments over the long term. However, the ongoing deferral of civil replacement into the latter part of this decade risks overlapping with the next anticipated military renewal cycle in the early‑to‑mid 2030s. Should this occur, pressure on production capacity and delivery lead times could intensify.

    In parallel, sustained increases in military utilisation could place additional strain on shared supply chains, particularly in parts availability and MRO capacity, with potential knock‑on effects for both civil and military operators.

    Oil prices: short‑term volatility versus structural impact

    Geopolitical conflict and associated oil‑price volatility have renewed concerns about a potential downturn similar to that experienced in 2014. However, there is currently little evidence to suggest that short‑term price movements alone will materially alter helicopter fleet dynamics.

    Chart 1: Offshore fleet evolution and crude oil pricing

    Source: Cirium Fleets Analyzer / U.S Energy Information Administration EIA

    The previous downturn was driven not by volatility, but by a prolonged period of sustained high oil prices, which encouraged aggressive fleet expansion based on assumptions of long‑term demand growth. When prices subsequently fell and remained depressed, the market was left with significant oversupply and prolonged pressure on utilisation and values. By contrast, recent pricing appears to have settled at a more sustainable level, around US$80 per barrel, historically supportive of offshore helicopter operations and a more balanced supply‑demand environment.

    While broader macroeconomic risks persist — including inflationary pressures and recessionary concerns that could weigh on values and investment appetite — the key takeaway for the helicopter industry is clear: sustained structural trends matter far more than short‑term volatility.

    A maturing helicopter leasing market

    The helicopter leasing sector has evolved significantly since its emergence around 15 years ago. Recent consolidation has concentrated a sizeable portion of the global leased fleet among a small number of major international lessors, contributing to greater stability and a more disciplined growth profile.

    Growth among established lessors has increasingly been driven by sale‑and‑leaseback transactions, rather than speculative order books, improving alignment with operator demand and reducing risk exposure. While leasing penetration remains lower than in commercial fixed‑wing aviation, there is clear scope for further expansion across multiple mission profiles, including EMS, utility, offshore energy and search‑and‑rescue operations.

    Johnston described the sector as “highly dynamic and competitive”, noting that “there remains considerable headroom for additional leasing activity, both globally and across different market segments”.

    del Mastro echoed this view, adding that increased competition is a positive development: “Coming from the fixed‑wing sector, where leasing choice is well established, I expect similar trends to continue developing in the rotorcraft market.”

    Deliveries and the outlook for the next decade

    Following delivery volumes of around 700 aircraft per year in 2023 and 2024, 2025 saw a modest decline, in line with expectations. Over the next decade, Cirium anticipates a gradual recovery, with average fleet growth of approximately 1.4% per year, equating to around 7,500 deliveries. Importantly for investors, more than half of these aircraft are expected to serve replacement demand, representing an addressable market of roughly US$50 billion on a full‑life value basis.

    Chart 2: Cirium Helicopter 10-year Fleet Delivery forecast 2025

    Source: Cirium 2025 Helicopter Fleet Forecast

    While extended lead times and ongoing supply‑chain constraints continue to limit near‑term deliveries, they have also reinforced supply discipline and supported asset values. From an operator and investor perspective, predictability and capital efficiency remain key priorities. del Mastro noted, “greater predictability on when aircraft can enter service is critical, alongside improved capital efficiency over the life of the aircraft and better access to competitive lease and debt financing”. She added that more predictable certification, STC processes and OEM production schedules would further enhance lifecycle optionality and returns.

    New technology: complementary rather than disruptive

    Emerging technologies — including autonomous helicopters, drones and eVTOL platforms — continue to attract attention. While progress is being made, their near‑term impact on the traditional helicopter market is expected to be complementary rather than disruptive.

    Initial applications are likely in cargo, logistics and unmanned operations, where certification and operational barriers are lower. More complex missions will take longer to materialise, particularly where energy density, safety and regulation remain limiting factors.

    A resilient market, well set up for gradual change

    The helicopter sector today is defined by stability and resilience rather than rapid expansion. Long asset lives, disciplined production, diversified missions and a more mature leasing ecosystem have reduced volatility and helped stabilise values.

    While supply‑chain constraints and geopolitical uncertainty remain, the overarching outlook is one of measured growth, delayed but unavoidable replacement demand, and gradual evolution rather than disruption. For operators, investors and OEMs alike, predictability, transparency and disciplined planning will be critical as we move into the next decade.

    Watch the webinar on-demand

    To access the presentation and watch Sara, Gabriela and Sarah’s full discussion, register to watch.

  • Measuring the impact of the Middle East conflict on global airline capacity

    Cirium Ascend Consultancy is trusted by clients across the aviation industry to provide accurate, timely, and insightful aircraft appraisals. The team provides the valuations and analysis the industry relies on to understand the market outlook, evaluate risks and identify opportunities.

    Discover the team’s industry reports & market commentaries. Read their latest expert analysis, viewpoints and updates on Thought Cloud.

    Richard Evans airline consultant
    Richard Evans airline consultant

    Team Perspective

    Richard Evans, Senior Consultant, Cirium Ascend Consultancy

    While it is too early to predict the length or macro-level effect on the global economy of the conflict in the Middle East, we can measure the impact to-date on airline capacity, via Cirium’s Tracked Utilisation data.

    At the start of 2026, Cirium Ascend Consultancy’s view was that global traffic (RPKs) and capacity (ASKs) would grow in the range of 4-6% versus 2025. This was broadly in line with the visible forward schedule, and also similar to IATA’s December 2025 Outlook, which predicted 4.9% global RPK growth.

    IATA reported January 2026 traffic was up 3.8% versus 2025, on capacity up 3.5%. It has not yet reported February figures, but Cirium data shows that actual ASKs flown grew by 5.3% last month.

    For March 2026, Cirium’s forward schedule, at the start of the month, indicated the airlines would expand capacity by 5.6%. This figure had already declined slightly compared to the advance March schedule at the start of the year, which showed growth of 6.8%.

    Our tracked data, up to and including 22 March 2026, shows that the number of passenger flights grew by just 1.2% over the same period in 2025. Unsurprisingly, the major impact was on Middle East domiciled airlines, which have experienced a 52% decline in flights year-on-year. The region made up just 4% of tracked flights in March 2025, but it has a far larger impact in terms of ASKs, as the airlines tend to fly larger aircraft and serve longer stage lengths than in other regions. It amounts to 10% of global ASKs, based on March 2025 data.

    The chart below shows March 2026 flown ASKs, by airline domicile region, compared to March 2025. The 56.5% decline in Middle East airline capacity contributes to a global contraction of 2.5% in the first 22 days of the conflict.

    Actual capacity flown 1-22 March 2026, versus planned schedule

    Other regions are also impacted, but to a lesser degree, with many airlines cancelling flights to the Gulf states, Saudi Arabia and Israel. Comparing the forward schedule for March with the actual ASK flown provides an indication of the impact. African carriers have seen a roughly 5-6 percentage point hit, with European airlines the second most affected, with flown ASKs up 2%, versus a planned schedule increase of 5.3%. Asian carriers have experienced just a one percent impact, but this obviously varies considerably, with Indian sub-continent airlines most affected. North American airlines have seen a similar effect, with United Airlines noting that suspending its services to Riyadh and Dubai knock about 1% from its ASKs.

    Looking further ahead, several airlines have announced that service suspensions to the Middle East will continue into April and May. However, the forward schedule at the time of writing has not changed dramatically. April 2026 currently shows 3.4% year-on-year growth in ASKs, compared to 5.4% immediately before the conflict started. May 2026 has fallen marginally, from 6.6% to 6.3%.

    Even if passenger load-factors remain high, with strong demand in other markets stated by several airlines, the conflict has led to an eight percentage-point hit to airline capacity in March. This is before we see any measurable impact from higher jet fuel prices on demand. This level of demand/capacity disruption, if it continues for any length of time, does imply a significant effect on aircraft utilisation rates and fleet plans.    

  • MRO Market Shakeup: Unpacking the 2025 Global Trends

    The maintenance, repair, and overhaul (MRO) sector is navigating a landscape marked by disruption and significant regional power shifts. Cirium’s webinar, Global Airframe MRO Trends: A Deep Dive, offered a detailed analysis of these changes. The session featured insights from Andrew Doyle, Senior Director for Market Development; Simon Mills, Principal MRO Research Specialist; and Finlay Grove, Product Manager, Ascend, who unpacked the data behind global capacity, utilization, and the geographic redistribution of MRO work.

    Key Highlights

    • Market dominance: The Asia-Pacific region is a dominant force in the MRO market, handling 50-70% of heavy checks and holding a 56% market share in widebody maintenance.
    • Capacity shifts: From 2019 to 2025, global MRO maintenance lines grew by 5%. Europe’s capacity increased by 28%, while North America’s declined by 20%.
    • Market concentration: In 2025, just 35 MRO providers were projected to account for approximately half of all observed heavy maintenance events.
    • Narrow-body distribution: Maintenance for narrow-body aircraft is more evenly distributed, with North America and Asia each holding a 34% market share, followed by Europe at 28%.
    • Efficiency gains: Newer generation aircraft are showing a structural reduction in the duration of C-Checks.

    The discussion centered on the significant geographic shifts occurring within the MRO industry. The data reveals a clear displacement of maintenance activity away from the historically strong markets of North America and Europe toward the Asia-Pacific region. Simon Mills highlighted that Asia has invested heavily in infrastructure and labor, enabling it to consistently fill its capacity year-round. This consistency gives the region an advantage over Europe, which experiences more pronounced seasonality with maintenance peaks in the winter.

    Finlay Grove explained that as a region Asia has done the best job of retaining the growth seen during the pandemic. The region’s ability to take on overflow work from North America, particularly for widebody aircraft, has cemented its leading position. This is driven by both capacity and cost, with labour rates in Asia Pacific remaining more competitive than those in Europe and North America.

    A tale of three regions

    While Asia’s growth is a central theme, the dynamics in North America and Europe present a more complex picture. North America has seen a decline in demand and a 20% reduction in maintenance lines since 2019. Despite this, the region maintains a 34% share of the narrow-body market, with airlines operating their aircraft with high traffic density.

    Europe, meanwhile, features a more fragmented market with a higher number of smaller MRO providers, often linked to national flag carriers. This structure supports a large number of seasonal airlines. The region has also seen a significant 28% increase in capacity, indicating ongoing investment and adaptation within its MRO sector. Elsewhere, Latin America is beginning to emerge as a contender in the narrow-body maintenance market. The analysis provided a clear view of a global MRO landscape in transition, where strategic investment and operational consistency are reshaping market leadership.

    To get the analysis and a deeper understanding of the forces shaping the MRO market, you can watch the full discussion on-demand.

  • How the Middle East conflict has hit daily flight hours

    Andrew Doyle
    Andrew Doyle

    Andrew Doyle, Senior Director – Market Development, Cirium

    With just over a week’s worth of utilisation data available since the Iran conflict began on 28 February, we can start to get a sense of the overall impact on daily flight hours trends for the global passenger jet fleet by airframe type and engine fit, writes Cirium Senior Director Market Development Andrew Doyle.

    Cirium fleet and tracking data can be used to calculate the year-on-year percentage changes in total tracked daily flying hours for some of the key aircraft/engine combinations, by comparing the seven-day rolling average for each day since late February 2026 with the equivalent day last year (364 days prior, to align days of the week).

    The chart below illustrates the effect the crisis has had on four-engined Airbus A380 and GE Aerospace GE90-powered Boeing 777 twinjet usage, given the large fleets flown by Middle Eastern carriers, although the lines are beginning to flatten out as Emirates in particular starts to recover its operations.

    Given the number of airlines that usually operate daily flights to Middle Eastern airports, most aircraft types have been negatively impacted to an extent, although for in-production models this has typically resulted in a dampening of year-on-year growth rather than an absolute reduction in total daily flight hours.

    It remains to be seen where these trend lines will settle if attacks continue over the coming days or weeks.

    Year-on-year % change in the seven-day rolling-average of total daily flight hours, by aircraft/engine