


The trend of airlines and stakeholders across aviation is to increasingly drive for greater operational efficiency and performance. Improving operations is seen as a profit driver through cost reduction and can also introduce service differentiators, thus driving up revenue.
In the context of running an airline, operational efficiency is input (labor, fuel, materials, aircraft flight equipment) into the running of the operations compared to the operational output (flights, ASM/ASK, freight tonnage, revenue).
When running an airline, competitive benchmarking is necessary to know how an airline compares to peers, partners, and competitors. Important benchmarks or key performance indicators help answer important questions such as:
- Is my performance great, in the middle or lagging?
- Where should I focus my attention to make the most meaningful operational improvements?
- What are the trends – am I making progress against my operational goals and objectives?
- How accurately does my real-world operational performance match planned schedules?
- Do I have the right balance of operational performance versus cost?
- How well are potential new routes being served by the current carriers?

Background
Prior to the pandemic, airlines focused on maximizing revenue in a high growth environment. In 2021, however, airlines are burning through their cash reserves, facing an uncertain growth environment, and turning their attention towards operational efficiency to preserve precious cash. On-time performance (OTP) has historically been viewed as a differentiator, especially for airlines that serve the corporate travel sector. But today, airlines are routinely achieving OTP numbers more than 90% while operating without the usual levels of congestion in airports and air corridors. Nonetheless, OTP is still an important indicator of operational efficiency and schedule integrity. Data-savvy airlines are finding new ways to reduce operating costs partly to survive the COVID-19 crisis and to position themselves to adapt and thrive in the post-COVID-19 era.
The industry is now driving hard on operational costs due to:
- Low-cost carriers raising the bar on efficiency and setting new cost benchmarks.
- Slowing growth for network carriers in the mature markets globally.
- Consolidation in the airline industry creating mega groups in search of cost synergies.
- Oil price instability and a market demanding a reduction in greenhouse gas emissions.
- Increased penalties on delays through passenger compensation (esp. Europe).
- On-time performance (OTP) anticipated return as a competitive differentiator.
- The unstable and unpredictable COVID-19 environment that makes data-driven insights more critical.
Today, operational efficiency is becoming a strategic imperative as:
- Aircraft utilization becomes more critical due to unstable traveler demand.
- Passengers and corporations consider the environmental impact when choosing flights and airline partners.
- Carriers seek to prioritize their most valuable passengers/flights during disruption.
- Flight delays represent an estimated cost in 2019 of $74.24 per minute of block delay according to a study by Airline for America and is responsible for billions of dollars in additional airline operational expense. FAA/Nextor estimated the annual costs of delays (direct cost to airlines and passengers, lost demand, and indirect costs) in 2018 to be $28 billion (about $86 per person in the US (United States)).
Many current systems for managing operations have often been reactive, focused on day-of –operations and recovery from disruptions. But increasingly airlines are becoming more proactive by leveraging AI, machine learning and analytics to get a leg-up on becoming more agile and operationally efficient – reducing operational costs, increasing aircraft utilization, and becoming more performance-oriented.
Operational KPI (Key Performance Indicators) and Competitive Benchmarking
While there are hundreds of airline operational performance indicators that airlines use to run their business, the best airlines focus on a handful of key performance indicators (KPIs) through which they monitor their overall operations and compare themselves to peers and competitors.
Common Operational KPIs include:(D0%) Departure On-Time – The percentage of scheduled flights that depart on-time or early compared to scheduled departure time – the strictest measure of an airline’s ability to depart at the scheduled departure time.
(A14%) Arrival within 15 Minutes – The percentage of flights that arrive within 15 minutes of scheduled arrival time. This is the industry standard for on-time arrival and provides a 15-minute buffer to account for potential delays that are beyond the airline’s control such as air traffic and airport congestion, or weather issues.
(B0%) Block-Time Performance – The percentage of flights that operate within their scheduled gate-to-gate flight time. This metric is a strong indicator as to whether schedule planning accurately reflects day-to day realities.
(CF%) Completion Factor – The percentage of scheduled flights that operated and were not cancelled.
Aircraft Utilization – A measure of aircraft productivity, calculated by dividing aircraft block hours by the number of aircraft days assigned to service on air carrier routes. Typically presented in block hours per day (per aircraft). Lower average block hours per day per aircraft typically translate into less utilization and a higher cost to the airline.
Poor, or less than optimal performance against any of the above sample KPIs at the airline network level would prompt an airline to look a performance at a more granular level like specific airports or routes to identify a pattern or trend which can be improved upon. It can also prompt an airline to use other KPIs that help narrow down a problematic aspect of their operation so it can be improved.
Let’s look at the above KPIs as applied to the American Airlines network over the first three months of 2021:
American Airlines
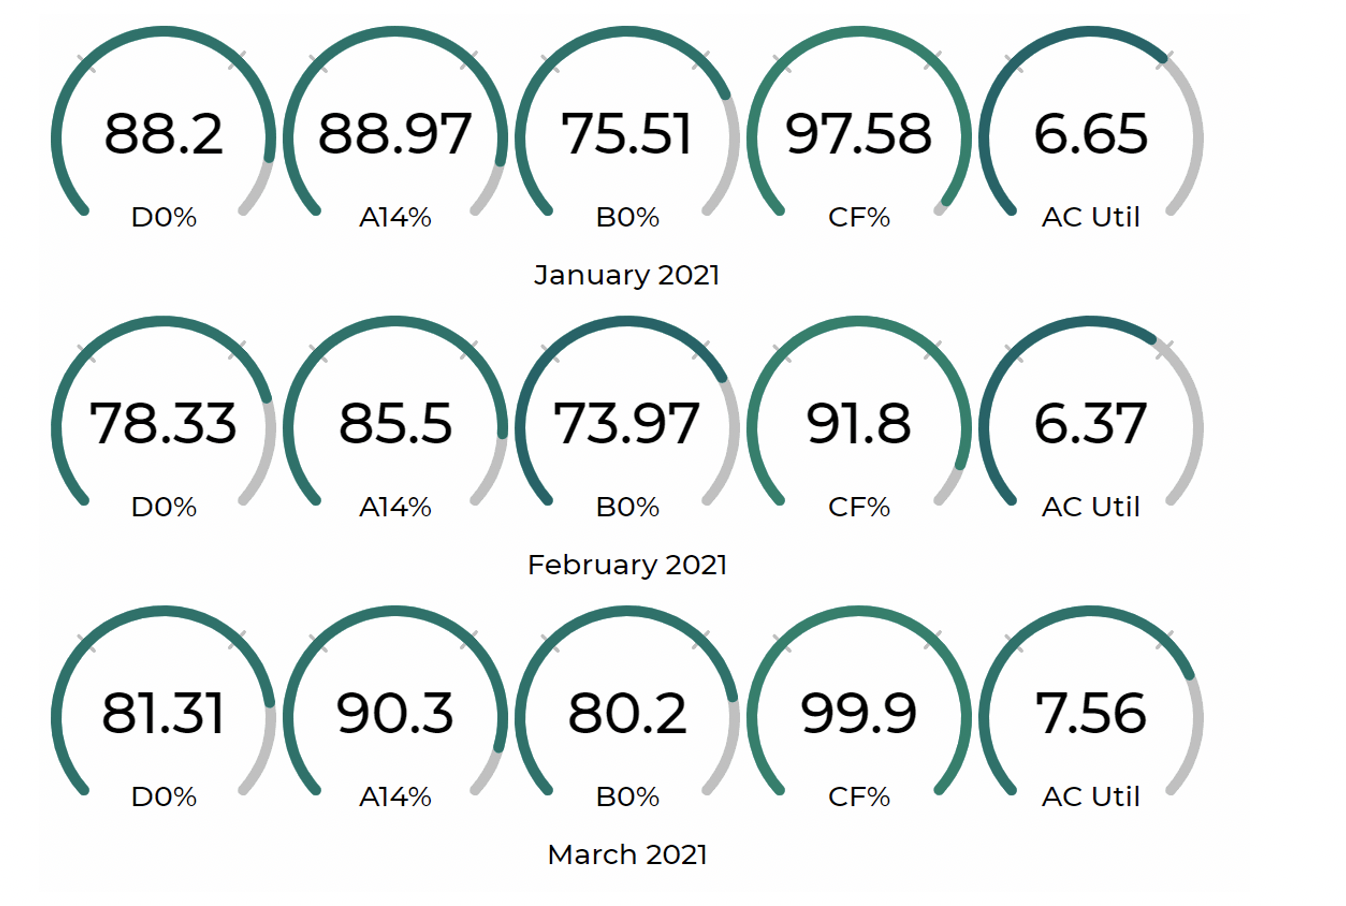
Across the five 2021 KPIs applied to AA (American Airlines), we see a small drop in performance in February compared to January followed by improvements in performance in March. This is where the KPIs are representing a dip in February performance compared to January and March. This type of highlighting of a pattern enables an airline to focus and analyze the causal factors and enable planning to help minimize such performance in the future. For example, Completion Factor % in February dropped to 91.8% compared to 97.58% in January and 99.9% in March. As you look at the underlying details, the February cancellations data for American reflects that of approximately 6,967 cancellations that month, 84% of those cancellations occurred February 14th-February 19th coinciding with the North American Winter Storm of 2021 that impacted Dallas (American’s primary) with ripple effects across the American Airlines network.
However, monitoring a single airline KPI in isolation has limited value. This is where competitive benchmarking becomes invaluable and provides the context necessary to understand performance.
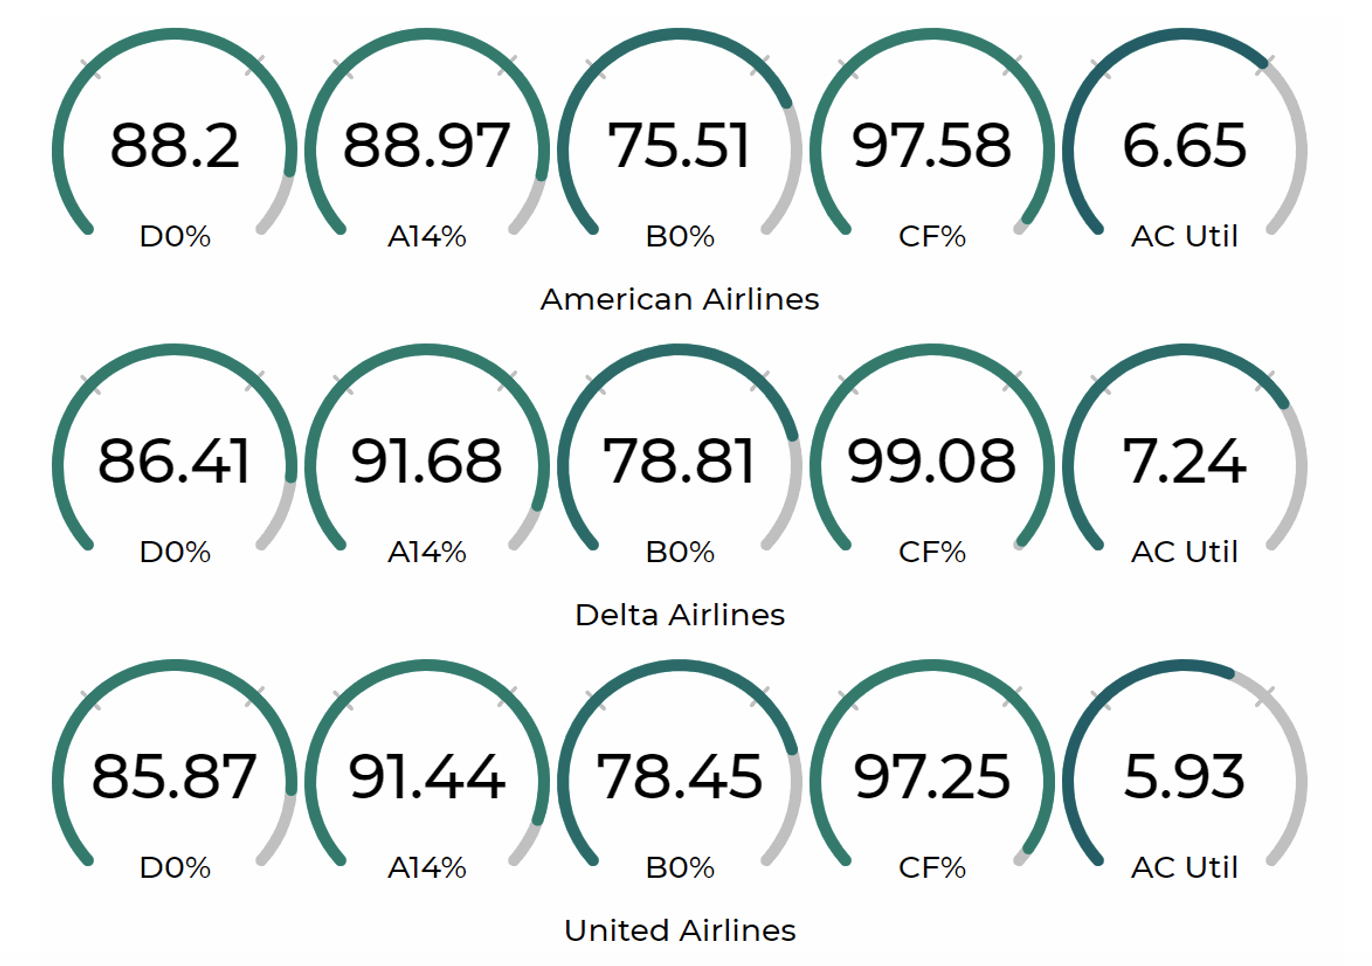
American Airlines compares to its two most significant competitors, Delta Air Lines and United Airlines. These are three of the largest airlines in the world with similar fleets and route structures.
January 2021
February 2021

March 2021
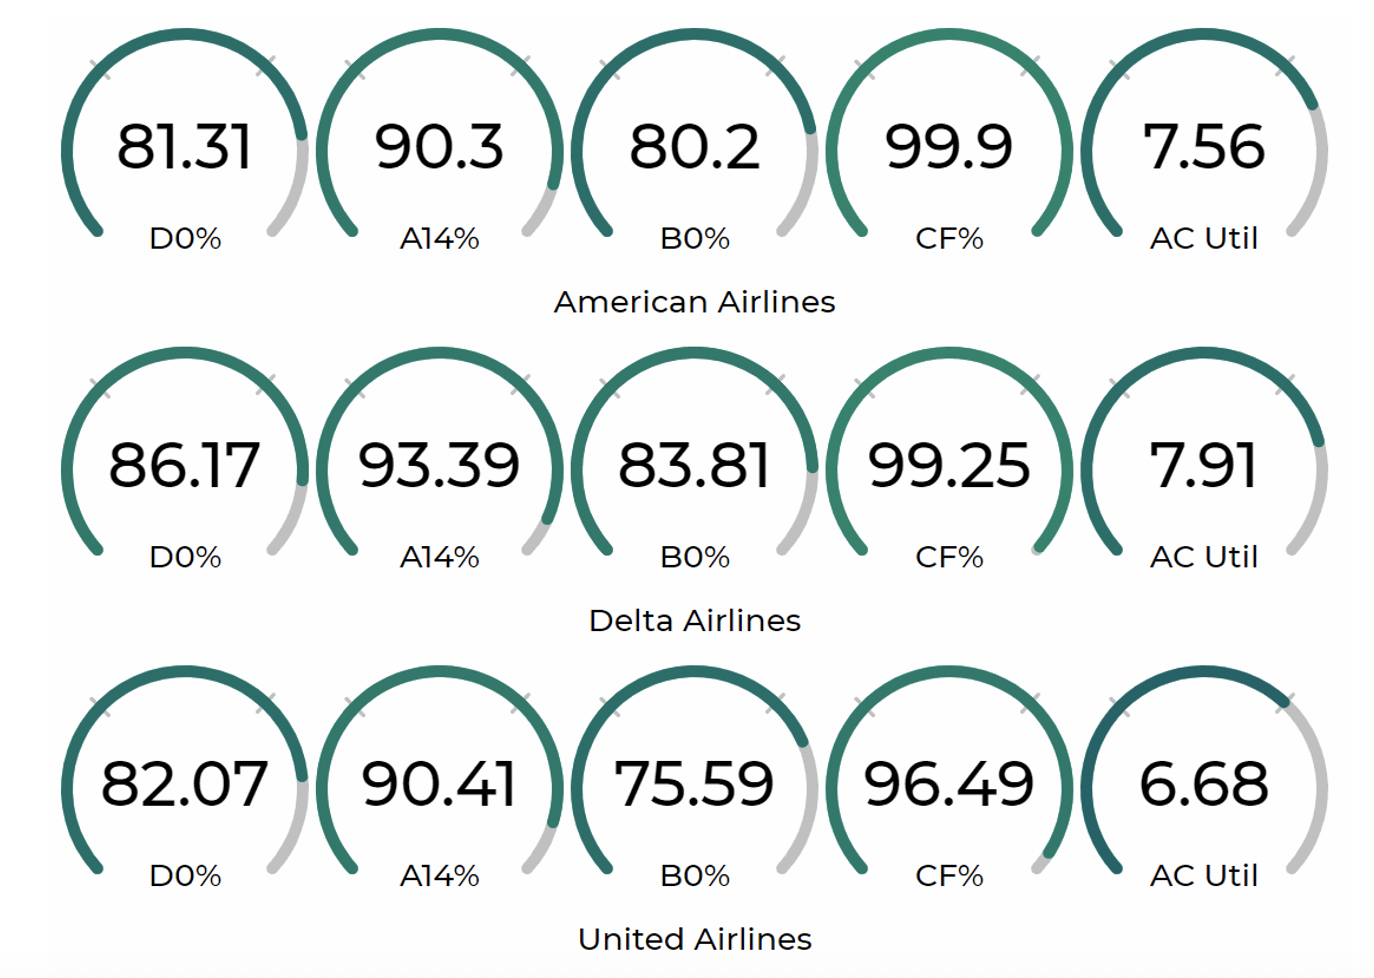
With the additional competitor context, we can see that Delta Air Lines is the top performer across virtually all KPIs. This type of analysis allows for better assessment of where each airline is operationally and provides leadership teams with the insights needed to set goals, design improvement plans and monitor progress. Also, Delta’s utilization of their aircraft is higher than that of American and United which may indicate they are more operational efficient by achieving better utilization of their aircraft for the higher operational performance.
The metrics used in this article are basic and represent a few examples of simple KPIs that are leveraged by airlines to monitor the performance of their operations. There are many other KPIs to monitor and benchmark operational performance and efficiency, such as average turn times, average departure/arrival delays, load factor, CO2 burn, and average taxi in/out times just to name a few.
Data and analytics can transform airline KPI monitoring and competitive benchmarking activities
High quality data takes the guesswork out of KPI monitoring and competitive benchmarking. Cirium offers comprehensive operational data (real time and historical) that enables powerful insights across airline partners and competitors. Cirium and advanced analytics equip planning and operations teams to collaborate in creating and maintaining a resilient and executable operating plan that matches the day-to-day realities facing every airline and delivers actionable competitive intelligence.
Learn more about how to manage KPI data, in one place, with Cirium Sky for Airline Operations.