By Rob Morris, Head of Global Consultancy, Ascend by Cirium.
In our recent Cirium LIVE webinar, ‘Permission to take-off’ on February 11, I provided an update on aviation’s flight-plan to recovery, including an analysis of global and regional demand trends based on schedule and flight-flown activity.
Executive summary
Conclusions
- COVID-19 continues to drive a stress scenario beyond anything we could ever have imagined for aviation
- Demand outlook for 2021 (and beyond) remains unclear as new strains and further infection waves cause travel (and other) restrictions to remain in place
- Vaccination programs offer cause for optimism, but it is too early to judge their national and global impacts on aviation
- Increasing progress could accelerate recovery over scenario 4 (read below), providing upside over most pessimistic demand recovery timescale
- Realistic recovery scenario suggests airline fleet in service will remain below end 2019 levels until 2022 at least, and possibly later
Ascend by Cirium – 2021 fearless forecast
- Airline passenger traffic will reach only 47% of 2019 levels by the end of 2021, domestic markets will lead the recovery
- More airlines will fail as globally they continue to burn $5-$6 billion cash monthly; well-funded majors and agile LCCs among the survivors
- Airbus & Boeing will deliver 1,200 new commercial jets in 2021 including 360 Max
- Passenger-to-freight (P2F) conversions will increase by almost 30% to 90 units
- There will still be around 6,000 passenger jets in store at the end of 2021
- Operating lessors will finally achieve 50% market penetration in 2021 but face a challenging year from a remarketing perspective
The graphs and analysis below present the data that informs our latest outlook.
Airline status and capacity outlooks paint a grim near-term picture
January traffic reports:
- Ryanair passengers -88%, Load Factor = 69%
- Wizz Air RPKs -82%SAS RPKs -89.5%, Load Factor = 29.9%
- Gol RPKs -37.2%, Load Factor = 83.2%
- Volaris RPKs -17.3%, Load Factor = 73.9%
- SIA Group expects 2021 capacity to reach 25% vs 2019 by end of April, less than 50% by summer
- Southwest expects capacity to be down 16% in March 2021 versus March 2020
- Ryanair estimates will only carry 5% of 2019 passengers in February 2021, implies capacity down 90% or more
Global aviation recovery scenarios (updated in February 2021)

The aviation recovery outlook many of you have seen and heard in our presentations in the last six months are forecasts based on our recovery scenarios. We’ve modeled several but we’re now focusing on two: the ones we call scenario 4 and scenario 5. We number them because we don’t want to give the impression that they are base case or that there are probabilities associated with them. Rather, we’ve modeled out some numbers and we are going to assess the market against them and see how we are performing. But there are some drivers: in scenario 4, you can see that we talked about the vaccine being widely available in mid-2021—some of the numbers suggest that is going to be the case in some markets but not all.
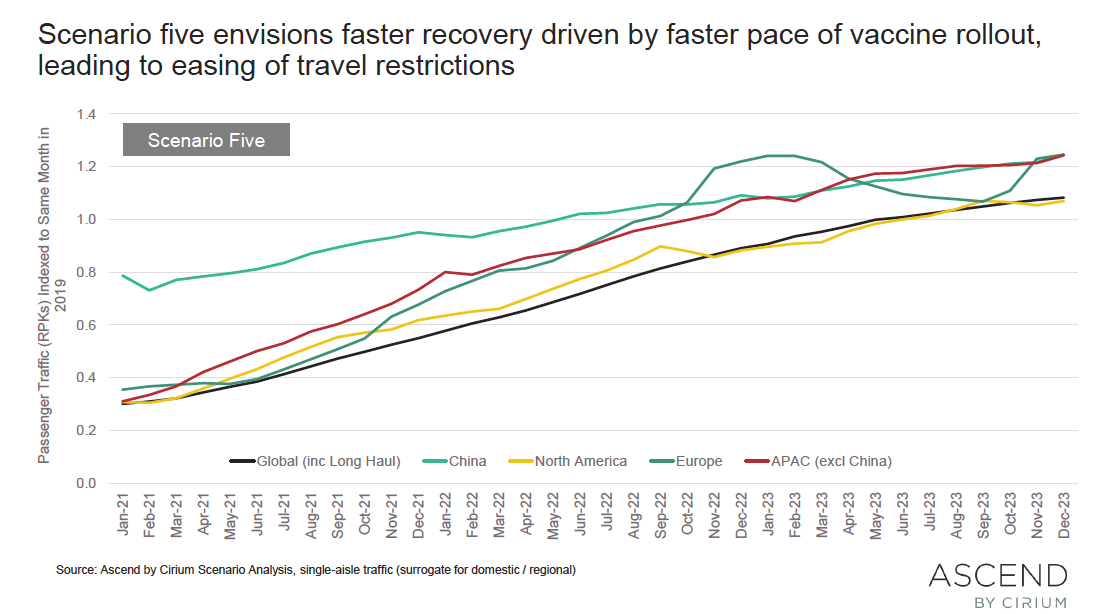
Then in scenario 5, we suggested that there is a faster recovery in the economy and also the vaccine efficacy or the vaccine rollout is more rapid as vaccines become more effective and more widespread. scenario 5 is an upside scenario to scenario 4. It’s important to keep these two key points in mind because the next couple of slides simply focus on domestic and regional markets which we expect to recover faster—and set out which we expect to recover in which way.
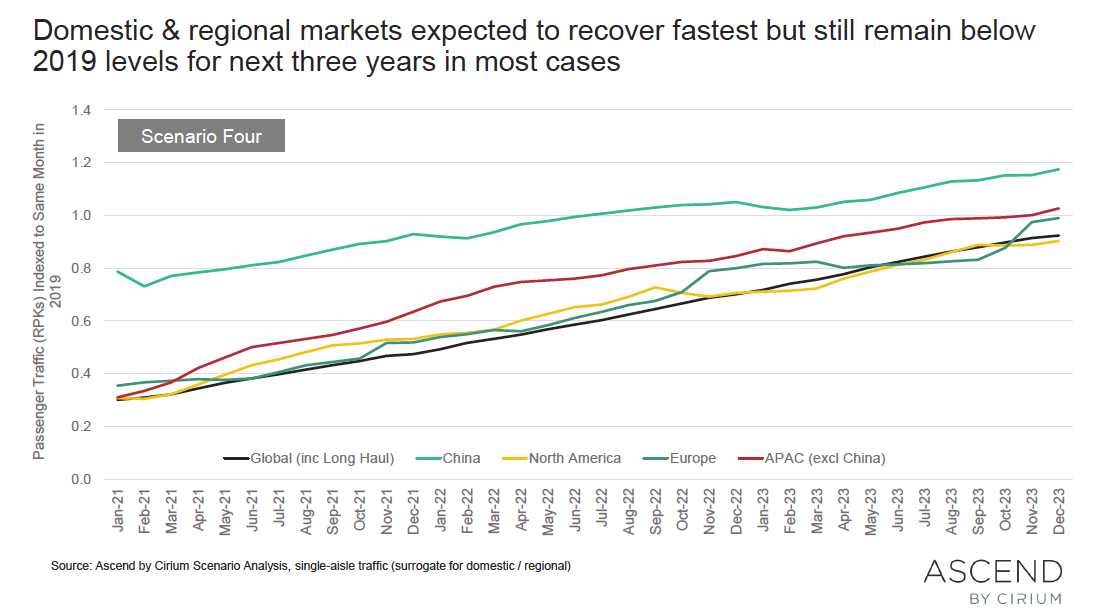
Aviation industry recovery scenario 4

I’m calling this domestic and regional markets, but our model actually models single-aisle and twin-aisle traffic and capacity. So, here I’m using single-aisle traffic as a proxy for domestic and regional traffic, so it’s not quite exact. The other point is we are measuring the increase in traffic on a monthly basis over the same month in 2019 as our baseline.
For example, as shown by the blue line at the top, we are measuring China against 2019 traffic. In January 2021, we expected traffic in China to be around 80% of what it was in January 2019—and frankly growing to the point where, by mid to early next year, it will be at the same level as it was in 2019.
And other markets are recovering you can see that we have North America inflecting around Europe and effectively getting back to around 80% of where it was in the summer of next year but actually not crossing where it was in 2019 before the end of 2023. So, that’s quite a long time away. So, that’s scenario 4—the most pessimistic active scenario.
Aviation industry recovery scenario 5

Scenario 5 is a more optimistic scenario where we see China recovering more quickly—China back to 2019 levels by the back end of next year. Europe also travellng at a decent rate and getting back much earlier, sometime in 2023. We see North America recovering to the same kind of level by the back end of 2023. These scenarios all have regional drivers to them but that’s the rate of recovery we’re expecting to see.
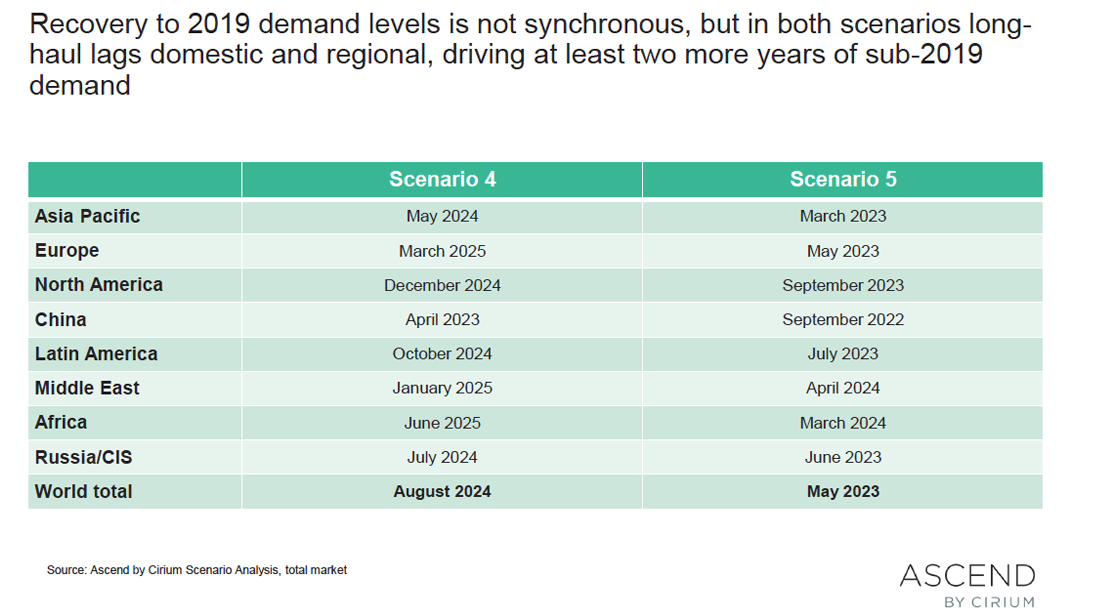
Recovery to 2019 demand by region

In absolute terms recoveries are not synchronous: in both scenarios, long haul lags domestic because long-haul requires two countries to be open. For example, between May 2023 and August 2024 is when we expect the world to get back to 2019 levels—so we’re looking at two to three years before we recover to demand of that level.
What does that mean for the metal?

We do expect there to be a significant fleet surplus because we can use the traffic numbers we have, and we can use productivity assumptions to model through the expected capacity by aircraft. And effectively, in each of these scenarios—and I’ve kept scenario 3 which we’ve now discredited effectively/we’re not now monitoring in quite the same way we did the others–we’re seeing aircraft surplus sustaining through late 2022 at best and late 2023 at worst. And that surplus is going to be a significant number of aircraft.
Discover more about Cirium’s consultancy business, Ascend by Cirium by learning more about our team of aviation experts, or alternatively if you want to you can contact the team here.
To see how Cirium is monitoring the impact of COVID-19 you can visit the company’s flight disruption resources page or track our weekly updates.


