Operational excellence continues to define Southeast Asia’s aviation landscape, as April results reveal meaningful gains in On-Time Performance (OTP) across leading carriers. The region’s airlines are increasingly demonstrating precision in execution, even as network complexity and passenger volumes continue to rise.
Singapore Airlines remains the benchmark for punctuality, while Cebu Pacific’s rise into the top tier reflects the growing sophistication of low-cost carrier operations. VietJet Air and Thai VietJet Air further underscore the region’s competitive intensity and commitment to performance optimization.
Download Now
Download the April 2026 Southeast Asia On-Time Performance Report
When you submit the form, you will be redirected to the latest Southeast Asia Monthly On-Time Performance Report. You will also receive an email with a link to the report for future reference.
SUBSCRIBE to be the first to hear about new Cirium reports and analyses.
March 2026
Amid a 72% surge in flight cancellations across Asia-Pacific, airline performance in Southeast Asia remained mixed. Some carriers improved On-Time Performance by up to 15 points, demonstrating greater operational resilience, while others recorded declines of nearly 3 points.
Singapore Airlines emerged as the region’s top performer, improving OTP by 10 points and surpassing Garuda Indonesia, which posted a 2-point decline.
February 2026
A 40% reduction in flight cancellations across Asia-Pacific helped Garuda Indonesia rise as the region’s On-Time Performance leader, reinforcing its position as one of the top-performing airlines in the market. Meanwhile, Singapore Airlines and Philippine Airlines remained among the most reliable carriers in Southeast Asia, despite month-on-month declines in on-time performance that point to increasing operational challenges, shifting airline performance trends, and evolving aviation reliability dynamics across the region.
January 2026
A 19% decline in flight cancellations in the Asia-Pacific market has directly contributed to improved schedule integrity across Southeast Asian carriers. Analysis of operational data shows that decreased disruption rates allowed airlines to achieve up to a six‑point increase in On‑Time Performance. This performance shift has also resulted in a reordering of OTP rankings, with a new leader emerging due to more efficient turnaround processes, reduced ground delays, and optimized fleet utilization.
Download complimentary monthly
Southeast Asia On-time performance airline reports
2026
Southeast Asia On-time performance airlines reports
Download the April 2026 On-Time Performance Report
When you submit the form, you will be redirected to the latest Monthly On-Time Performance Airline and Airport Report. You will also receive an email with a link to the report for future reference.
SUBSCRIBE to be the first to hear about new Cirium reports and analyses.
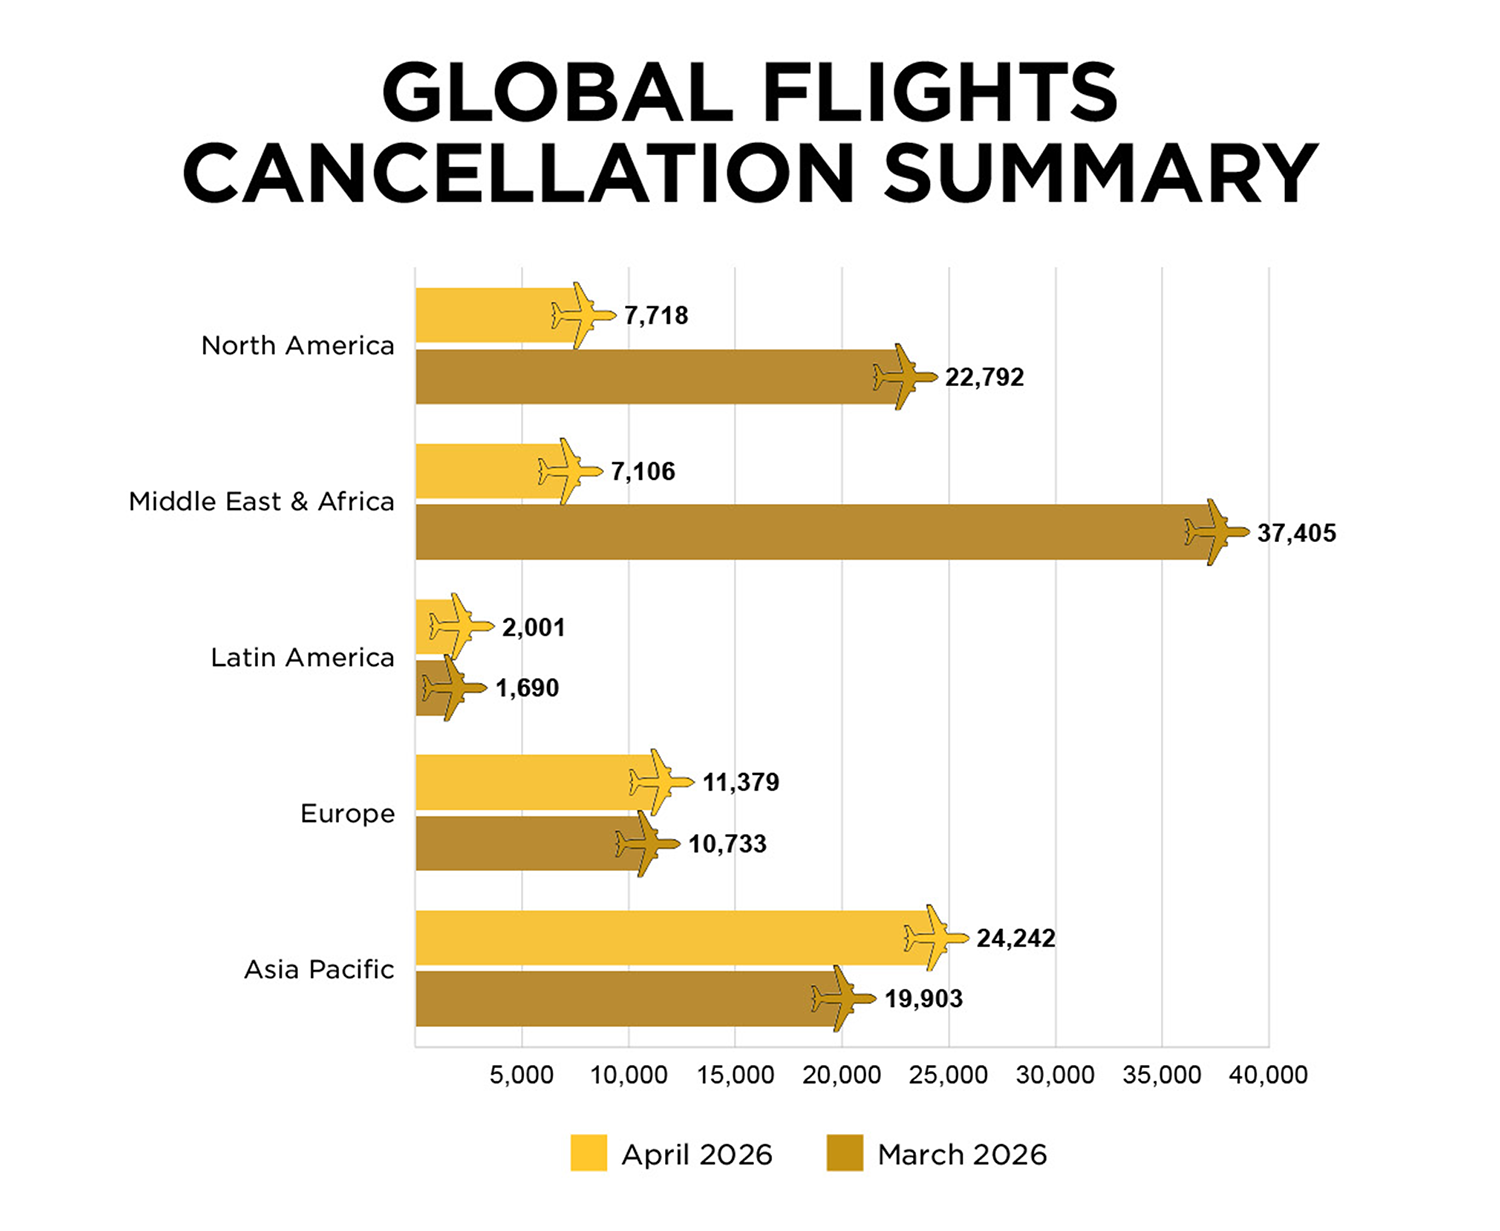
Global OTP Summary – April 2026
April delivered a measurable improvement in global operational performance. Flight cancellations declined 43%, with North America and Middle East & Africa recording the steepest reductions — down by up to 81%.
But lower cancellations also raise the bar. When disruption eases, the industry gets a clearer view of operational performance — separating airlines and airports with sustained reliability from those still catching up.
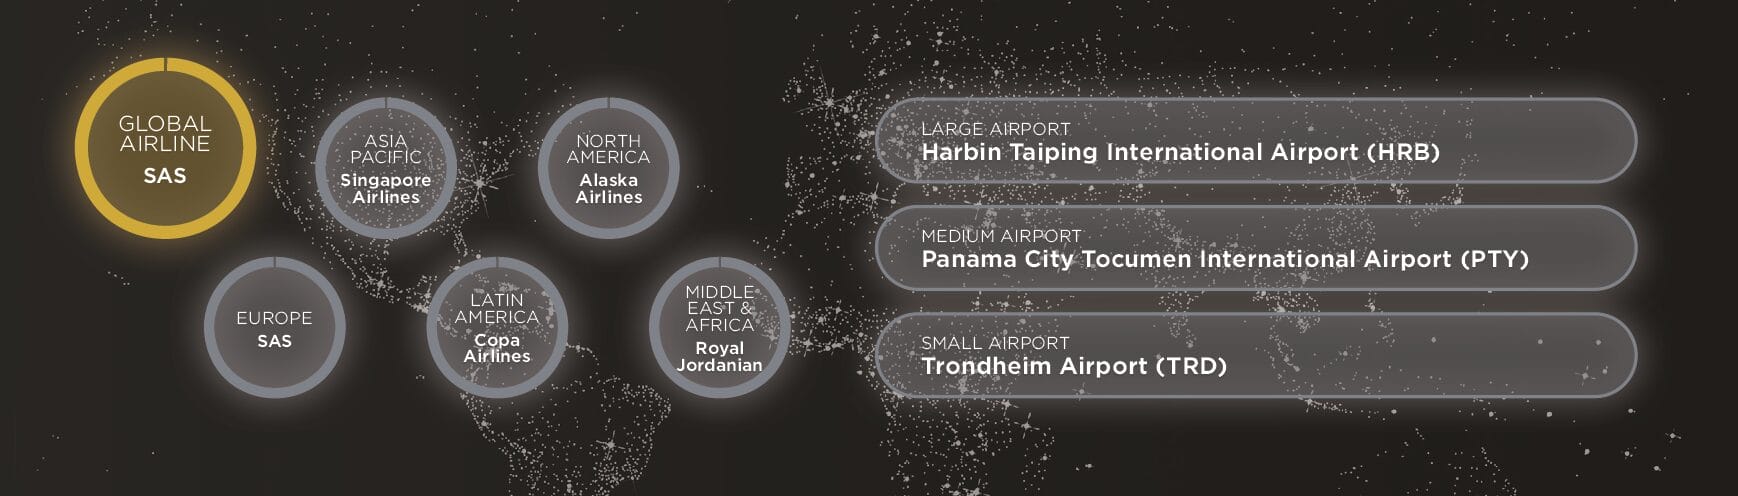
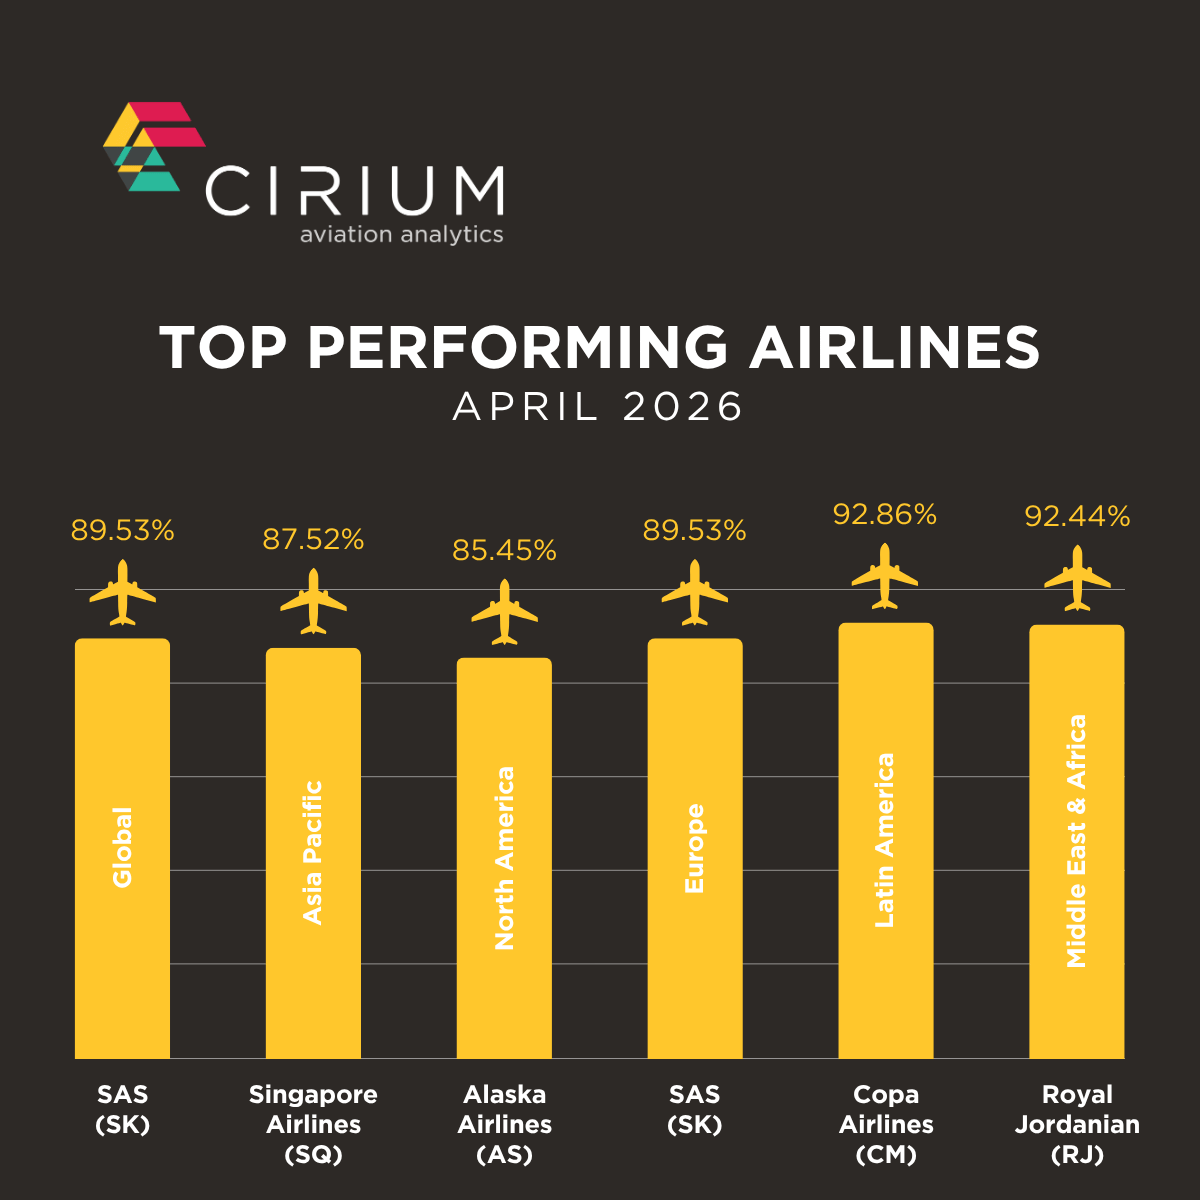
Airlines setting the pace
SAS led global airline OTP with an 89.53% on-time arrival rate and became Europe’s top performer.
Singapore Airlines continued to lead Asia-Pacific.
Alaska Airlines remained the strongest performer in North America.
Copa Airlines led Latin America.
Royal Jordanian stood out as the most-improved airline, increasing OTP by 25 points.
Global Cancellations Report
Learn more about Cirium On-Time Performance and download 2025 Reports, here.
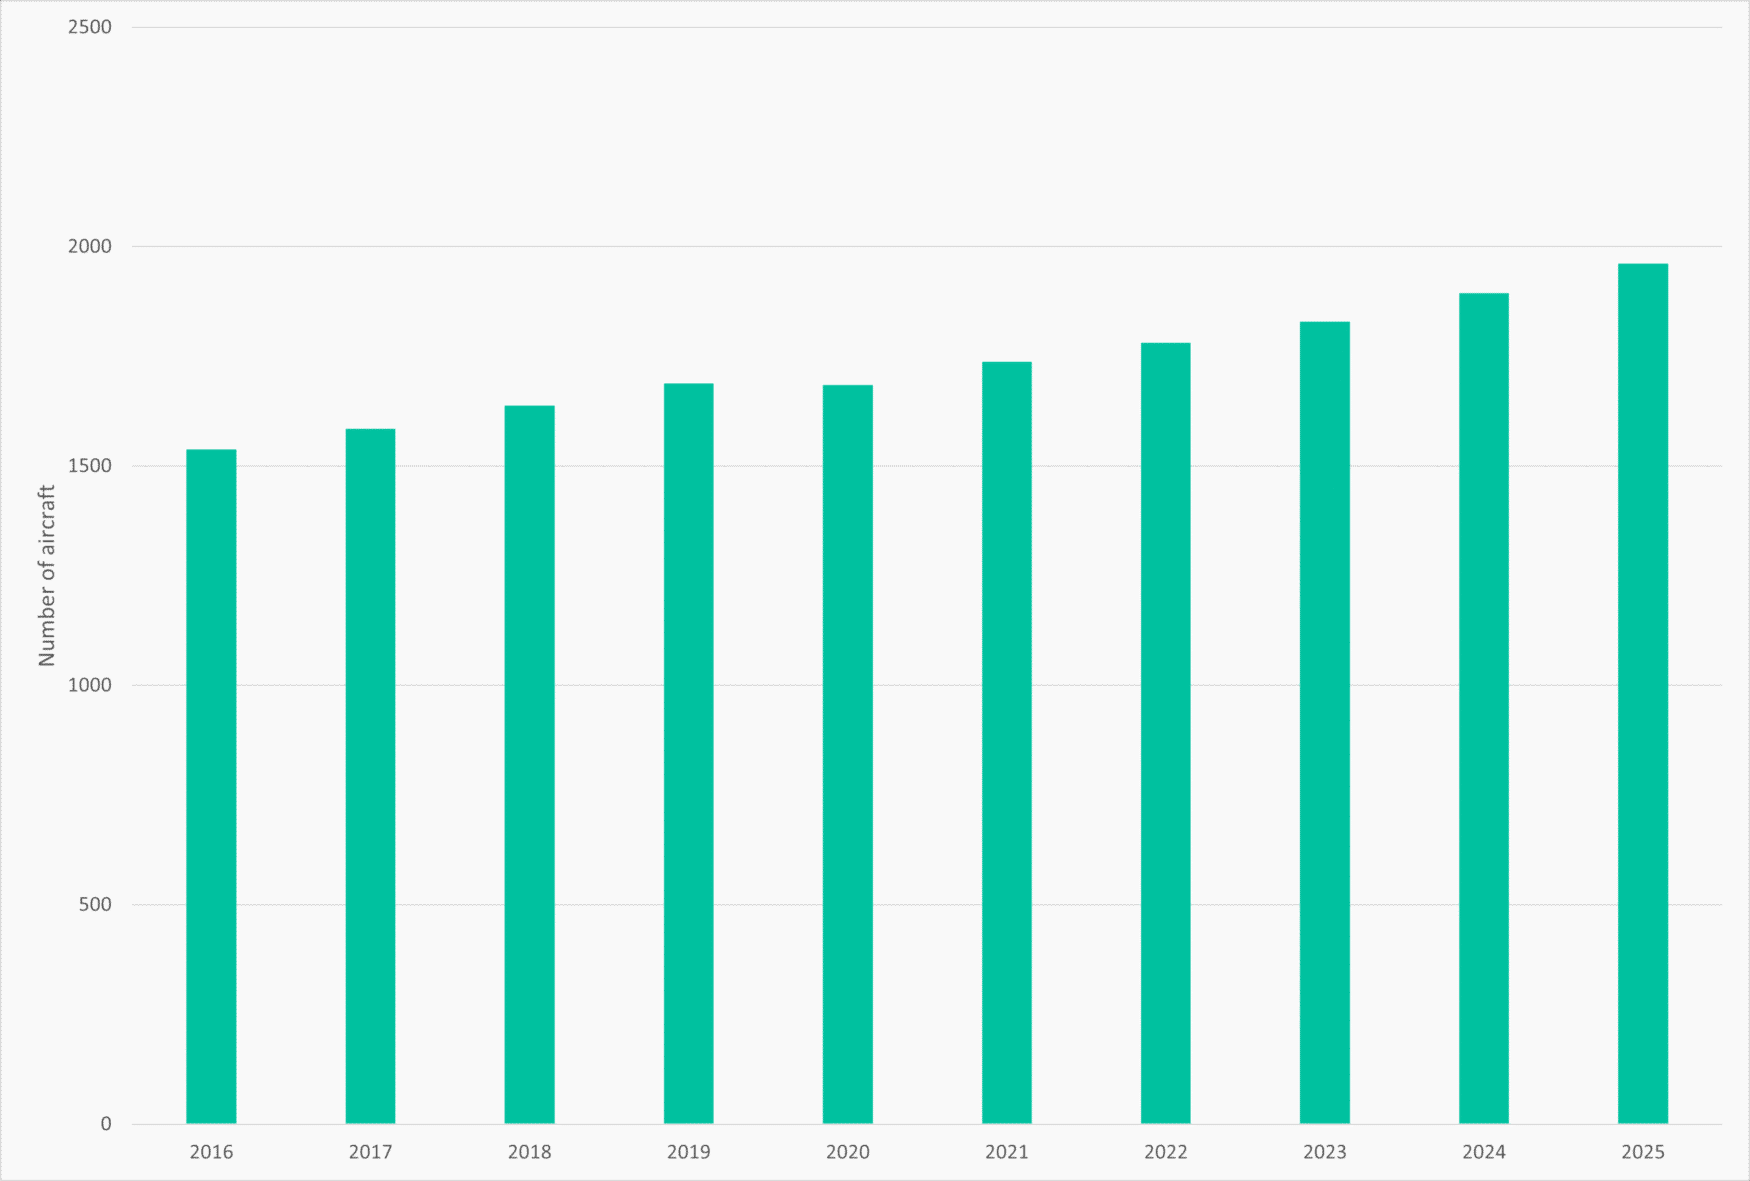
Between 2015 and 2025, the intermediate twin-engine helicopters have recorded consistent growth in fleet size, resulting in an increase in their share of the overall fleet. This reflects a sustained expansion of the segment alongside broader market growth. Historical fleet data is based on year-end positions, while forecast data reflects the 2025-2034 outlook.
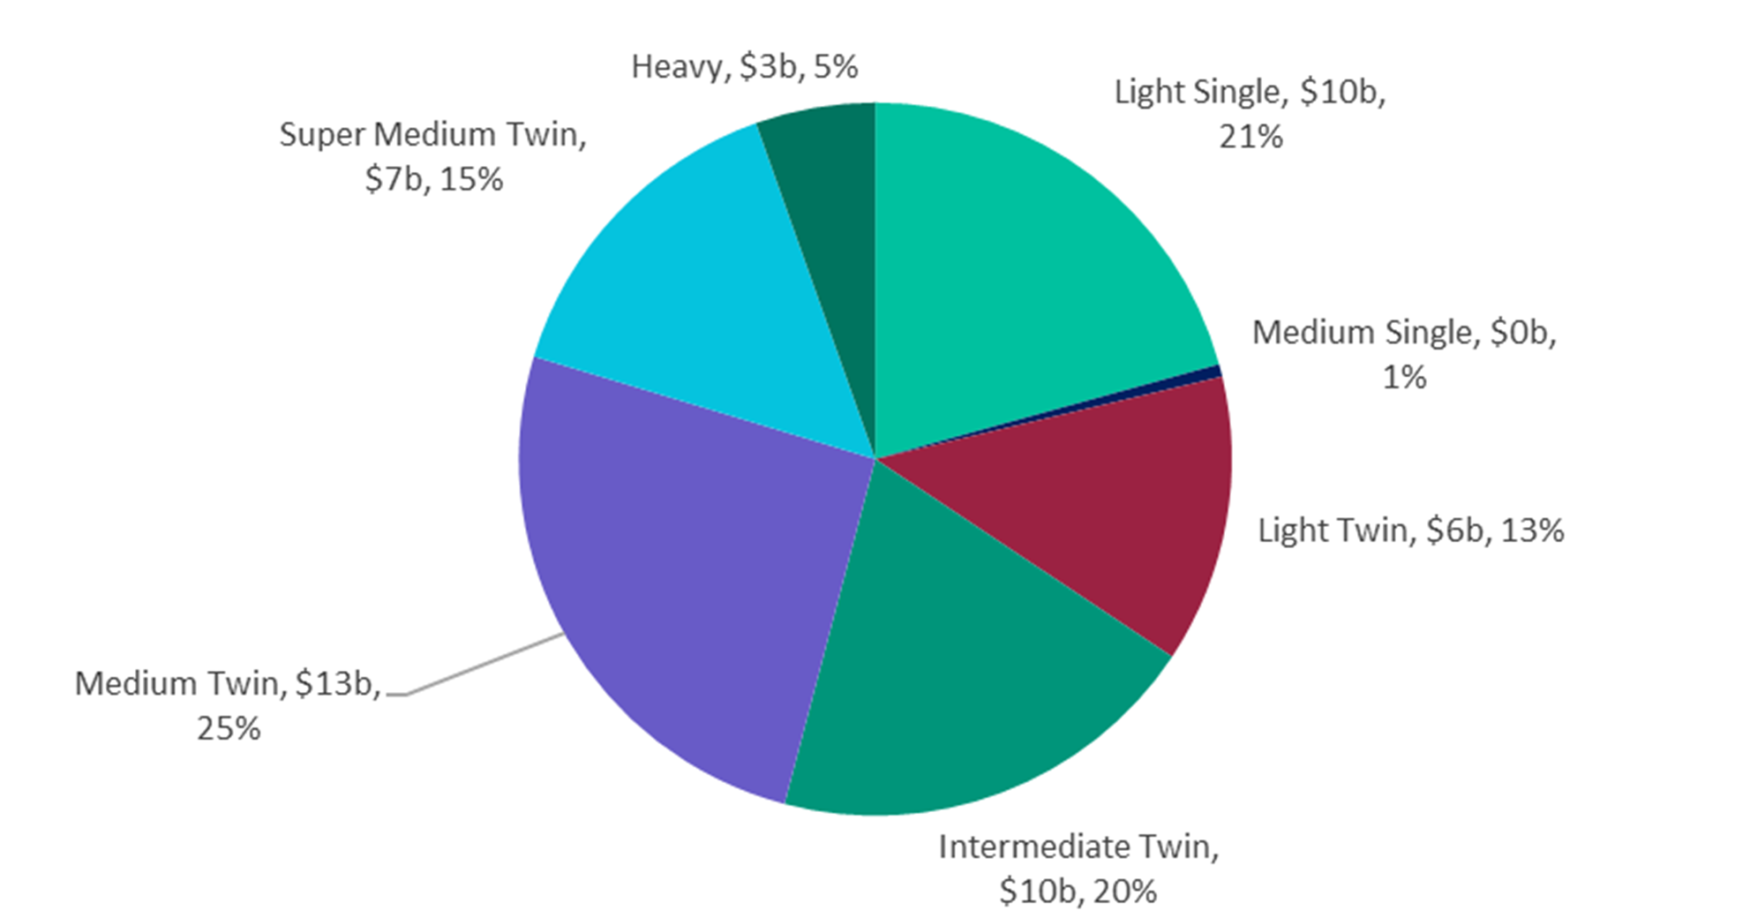
The Cirium Helicopter Fleet Forecast (2025) indicates that intermediate twins accounted for approximately 10% of total deliveries over the past decade and are expected to increase to around 14% over the next ten years, representing a rise of approximately four percentage points. In value terms, the segment is forecast to represent approximately 20% of total market value, equivalent to around $10 billion between 2025 and 2034. This positions the intermediate twins as the third largest segment by value, supporting their growing importance within the overall market.
Chart 1 shows that intermediate twins have experienced consistent growth in fleet size over the past ten years, broadly tracking their share within the fleet mix.
Chart 1: Intermediate-twin in-service fleet trend – past 10 years
Source: 2025 Helicopter Fleet Forecast
The 2025 Helicopter Fleet Forecast highlights the forward outlook for the segment, with intermediate twins expected to account for approximately 20% of total market value over the 2025 to 2034 period. This reflects continued demand for aircraft that provide a balance between capability and cost, supporting their position as a core segment within future market activity.
Chart 2: Fleet forecast of civil helicopter deliveries by value 2025-2034
Source: 2025 Helicopter Fleet Forecast
Fleet development data, further illustrate how these trends translate at an asset level. The Airbus Helicopters H145/EC145 fleet has grown from fewer than 100 aircraft in service in the early 2000s to approximately 900 aircraft by end of Q4 2025. Over the same period, storage levels have remained below 5% of the fleet, indicating that the majority of aircraft are actively deployed. This is relevant from a value perspective, as low storage levels typically indicate that supply is closely aligned with demand, supporting liquidity and reducing the risk of downward pressure on values. At the end of Q4 2025, 486 H145/EC145 aircraft were in service in the Emergency Medical Services (EMS) sector across 74 operators worldwide. This concentration within a single mission profile demonstrates the aircraft’s established role in core segment and supports consistent demand.
The Leonardo AW169 shows a consistent growth profile, with the fleet increasing from entry into service 2015, to approximately 200 aircraft by Q4 2025 with storage levels remaining minimal. This indicates that new deliveries are largely being absorbed into active operations. As of Q4 2025, 59 aircraft were deployed in EMS roles across 19 operators worldwide, showing that the type has also established a presence within key mission segment.
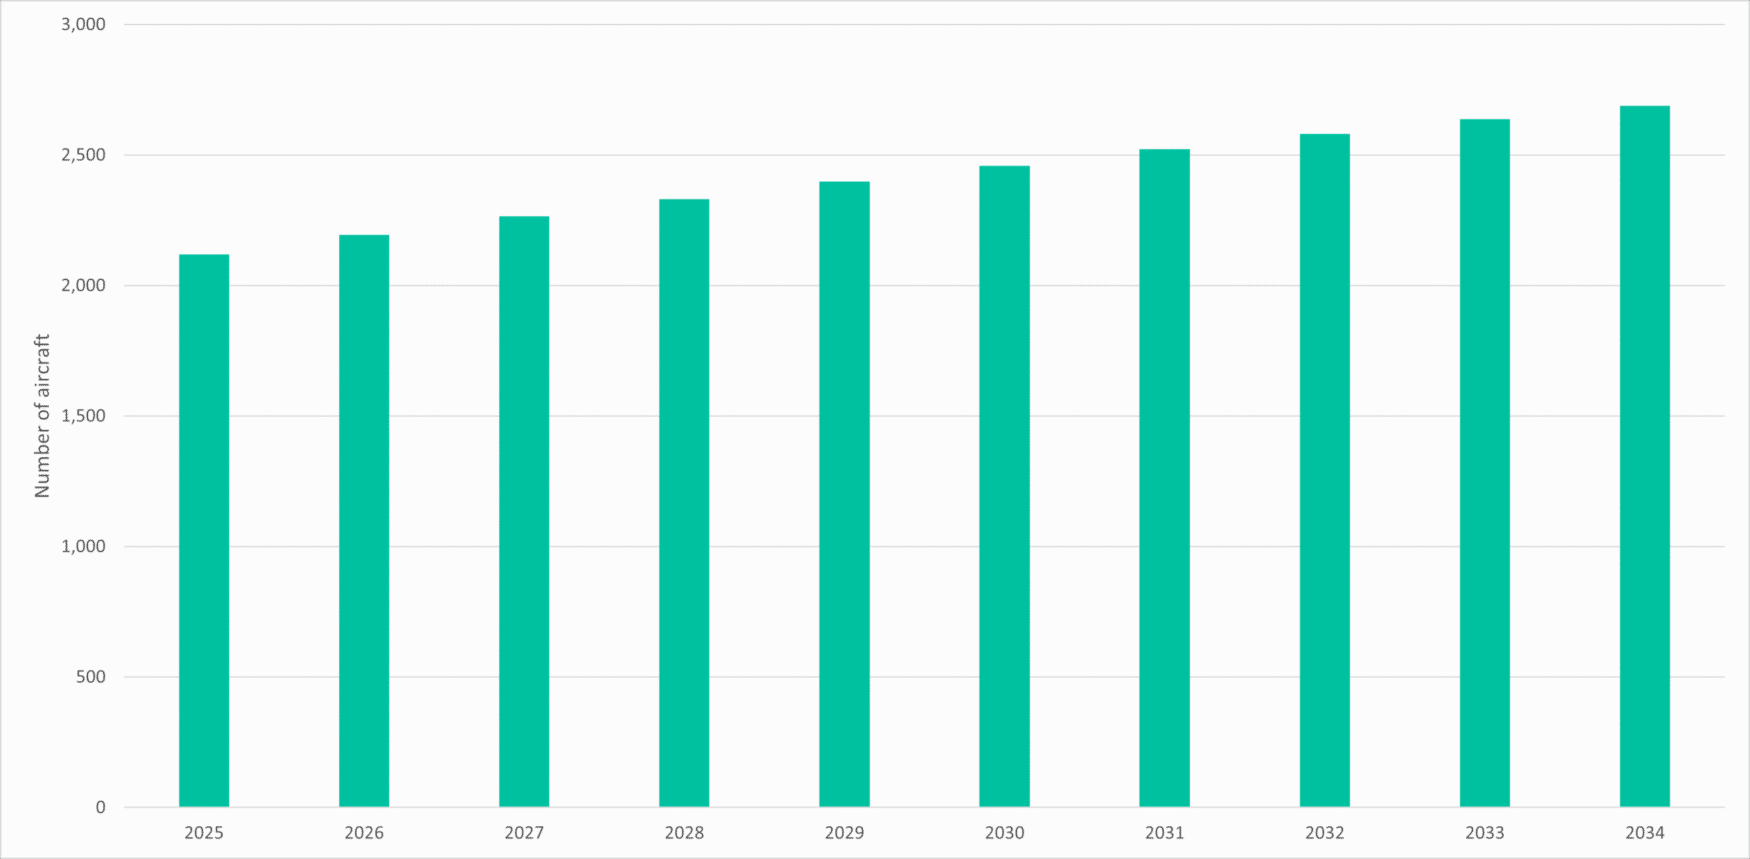
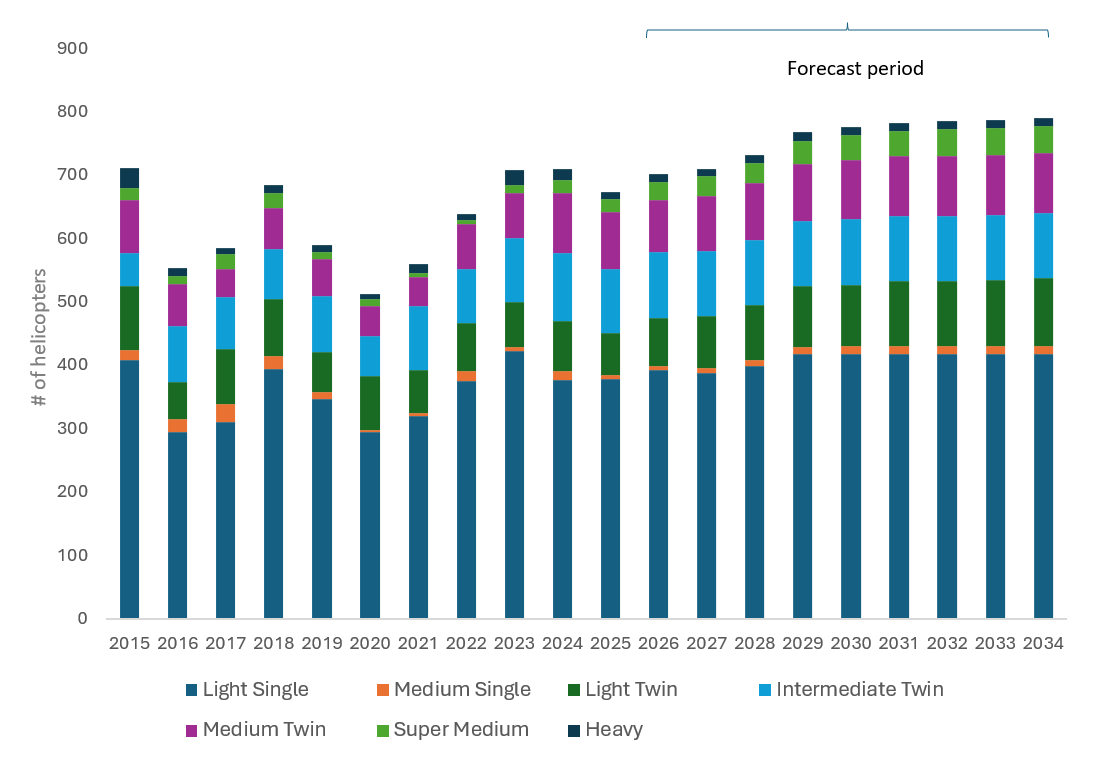
Chart 3 shows that intermediate twin helicopters are expected to increase their share of total fleet over time. When considered alongside historical fleet development, this indicates that the segment’s growth is both established and expected to continue over the forecast period to 2034.
Chart 3: Forecast intermediate-twin helicopter fleet to 2034
Source: 2025 Helicopter Fleet Forecast
The expansion of intermediate twins over time reflects broader changes in how operators are selecting aircraft. In Europe in particular, intermediate twins have become increasingly prevalent in EMS operations following regulatory changes which amongst other things include the requirement of improved safety performance in the event of an engine failure. This has contributed to a shift from smaller platforms towards aircraft capable of meeting these requirements, supporting increased adoption of types such as the H145. As a result, replacements and upgrade activity have seen types such as the AW109 and H135 moving into secondary markets, particularly outside Europe, where requirements and mission profiles differ.
From a value perspective, fleet scale and utilisation across multiple operators are key indicators of market depth. The H145 benefits from a larger installed base established operator network, supporting consistent levels of market activity and stable storage trends. The AW169, has demonstrated consistent fleet growth since entry into service and increasing deployment across multiple mission profiles, including EMS (28%), law enforcement (24%) and corporate use (20%). This diversification supports demand across different end markets and contributes to overall market stability.
Leasing activity provides additional support to the segment. The 2025 Helicopter Fleet Forecast indicates that leasing activity has increasingly expanded into intermediate twin helicopters, with the segment accounting for approximately 15% of lessor focus in recent years. This reflects growing confidence in the long-term demand profile. The missions supported by the H145/EC145 and AW169 are often long-term contracts, backed by governments providing favourable credit. Such structures provide predictable revenue streams and contribute to lower perceived asset risk, supporting value retention.
Looking ahead, the increase in market share over the past decade suggests that intermediate twins are becoming an important part of the fleet mix. This is supported by their ability to operate across a range of missions while maintaining a cost profile that is lower than larger aircraft categories. At the same time, continued fleet growth, low storage levels and expanding leasing activity indicate that demand remains aligned with supply.
Overall, the intermediate twin helicopter segment is supported by sustained fleet growth, increasing the share of total market value and continued expansion across core mission profiles. Aircraft such as the Leonardo AW169 and Airbus Helicopters H145/EC145 illustrate how fleet development, regulatory influences and market depth contribute to value behaviour. As the segment continues to mature, its increasing share of total market value combined with consistent fleet expansion and low storage levels, suggest that intermediate twins are likely to remain a core focus for both operators and lessors, supporting continued liquidity and stable value performance over the medium term.
Sometimes the best stories in aviation are the ones nobody sees coming.
On March 19th, I presented the Cirium On-Time Performance Award for the Most On-Time Airline in Asia Pacific to Philippine Airlines in Manila. Two thousand employees filled the room. The event was televised to those who couldn’t attend. The airline was celebrating its 85th anniversary and chose that milestone to also celebrate something earned in real time, an operational performance that put it ahead of every other carrier in the region. When the results hit the screen, the room erupted. Having run Cirium’s OTP program for the past seven years, a program now in its 17th year as the industry standard, I have stood in front of airline teams around the world. Few moments have matched that one.
The data tells the story. In 2022, Philippine Airlines did not place among Cirium’s top ten most punctual airlines in the Asia‑Pacific region. By 2023, PAL entered the rankings at eighth place, and rose further to seventh in 2024. In 2025, that trajectory culminated in a number one ranking, with an on-time performance of 83.12 percent. Improvements of that magnitude do not happen by chance. September 2025 hit 90.47%. PAL claimed first in the regional rankings four times: April, August, September, and October. That is not a hot streak. It is the result of consistent operational performance, built on a foundation established over three years.
In every top-performing airline I have studied, the pattern holds. It starts with a commitment from the management team that the airline will be an on-time airline. It requires strong relationships with operational partners. And it demands continued investment in equipment, training, and analytics. But the airlines that sustain it share something deeper: a culture where reliability is not a goal but a standard, where it is measured, owned, and part of how every team operates.
Richard Nuttall, President, Philippine Airlines
What makes this personal is the man now leading the airline. Richard Nuttall became PAL’s president in May 2025, the first foreign national to hold the post in the carrier’s history. Richard and I go back to our time at Cathay Pacific Airways in Hong Kong, where I was an embedded consultant from Sabre helping the airline implement crew scheduling, revenue management, and flight and operations control systems. His career since has taken him across five continents, through leadership roles at Kenya Airways, Royal Jordanian, Saudia, as CEO of Bahrain Air, and most recently as CEO of Sri Lankan Airlines, where he steered the carrier back to profitability. What connects all of it is a consistent ability to walk into difficult situations and get the operation running right. After the ceremony, Richard told me this was just the start, that the airline has enormous potential still to unlock.
Lucio Tan III, President and COO, LT Group, Inc and PAL Holdings, Inc
That momentum is now being carried forward by a leadership team guiding Philippine Airlines’ path ahead. Lucio Tan III, the Stanford‑educated grandson of patriarch Dr. Lucio C. Tan, serves as President of PAL Holdings. Bringing in someone with Nuttall’s international track record alongside next‑generation ownership signals a group that knows where it wants to go. Carlos Luis Fernandez rounds out the team as EVP / COO.
The fleet strategy fits. PAL took delivery of its first Airbus A350-1000 in December, the first in Southeast Asia, with eight more arriving through 2027. New aircraft are easier to keep on schedule, and fleet renewal at this scale reinforces the operational gains that drove the OTP results.
Lucio Tan III, President and COO, LT Group, Inc and PAL Holdings, Inc
Every on-time arrival is a promise kept. Philippine Airlines kept that promise more consistently than any airline in Asia Pacific last year. The leadership is in place, the fleet is arriving, and the culture is delivering. This is an airline that has earned the right to be taken seriously.
Cirium Ascend Consultancy is trusted by clients across the aviation industry to provide accurate, timely, and insightful aircraft appraisals. The team provides the valuations and analysis the industry relies on to understand the market outlook, evaluate risks and identify opportunities.
Richard Evans, Senior Consultant, Cirium Ascend Consultancy
Three weeks ago, Cirium’s forward schedule data for April 2026 showed a 3.4% year-on-year growth in ASKs, compared to 5.4% immediately before the conflict started. For May 2026, planned capacity had fallen marginally, from 6.6% to 6.3%.
Since then, airlines have continued to adjust their near-term schedules, as a direct result of airspace and airport disruption in the Middle East, as well as due to the cost impact of a doubling in jet fuel prices. The latest schedule data now shows that April 2026 ASKs are down by 2.0% year-on-year, in-line with the March 2026 actual flown capacity. May 2026 capacity has now been cut by around three percentage points, to stand at 3.4% growth over May 2025.
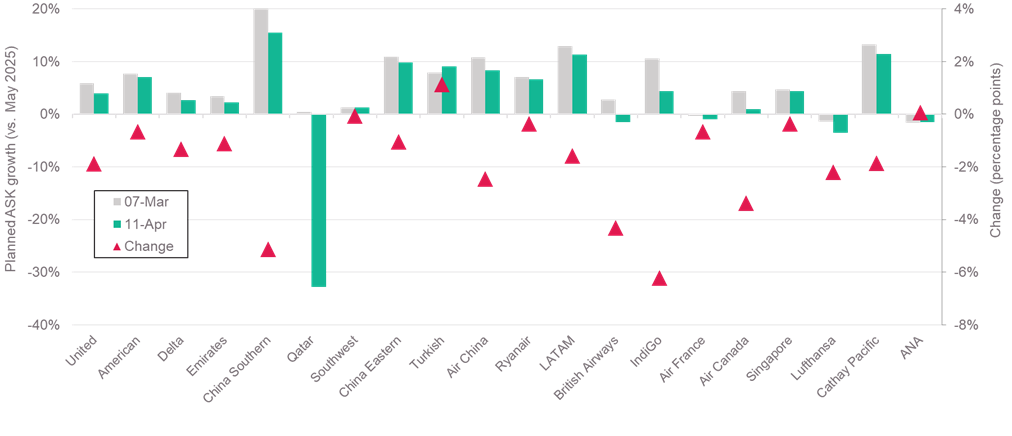
The chart below shows the latest May 2026 capacity plans of the 20 largest airlines, in terms of ASKs. With one exception, Turkish Airlines, all the airlines have cut their May schedule. Most have made reductions of 0-5 percentage points, consistent with the global change of 3%. There is a noticeable contrast between Qatar, with schedule now down 33% versus May 2025, and Emirates, who still plan a 2.4% year-on-year growth.
All regions have seen schedule cuts, with major airlines in North America, Europe and Asia Pacific reacting to a similar degree. The two purely short-haul carriers in this sample, Southwest and Ryanair appear to have been impacted less, making cuts of less than 1% at present.
It appears extremely likely that more reductions are ahead. Delta guided to flat year-on-year capacity in Q2 2026, against its current plan of 2.7% growth and Ryanair hinted it might trim schedules by 5-10% if jet fuel prices remain at their current levels.
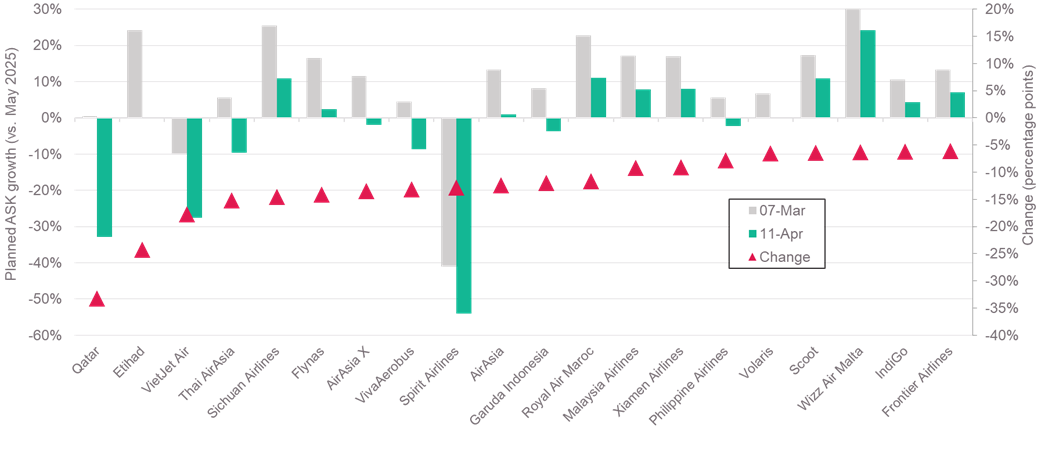
Turning to the 100 largest carriers, those with the biggest reductions in planned capacity unsurprisingly have several from the Middle East at the top of the list. However, there are airlines from a wide variety of countries represented in the data. Southeast Asian carriers appear to have been greatly impacted, consistent with media reports of fuel supply shortages in Vietnam and Philippines. Airlines from Malaysia and Indonesia have also cut planned schedules by around 10-15%. Some smaller Chinese airlines are also included, such as Sichuan Airlines and Xiamen Airlines.
Some of these airlines were planning on very large capacity expansions, and their latest schedules still imply year-on-year growth of 5% or more. Nevertheless, the list appears to show particular impact for some of the LCC carriers in Asia and the Americas.
Planned capacity for May 2026 – biggest schedule reductions
Source: Cirium schedules data, Cirium Ascend Consultancy analysis, Top 100 airlines by Jan 2025 ASKs
With the Iran conflict not fully resolved, it is clear that 2026 will experience a significant slowing of traffic and capacity, compared to Cirium Ascend Consultancy’s initial prediction of 4-6% growth over 2025. The impact will clearly be both deeper and more prolonged the longer the conflict continues and the longer jet fuel prices remain at their current levels, with second-order economic effects and risks increasing.
We have constructed some initial scenarios to estimate the global impact on the aviation market, which have been shared in more detail to our Commercial Aviation Monitor clients, and at industry events. These are based on modelling month-by-month capacity profiles for each airline domicile region, in the same way we considered the impact and recovery from Covid-19. The scenarios produce a range of outcomes, with 2026 global capacity change ranging from a decline of 2-3% to growth of 1-3%.
The more severe scenarios will require airlines to take additional action. Older, less fuel-efficient aircraft are the most likely to see utilisation cuts or parking. Airlines will seek to preserve cash in such circumstances, implying maintenance deferrals and fewer lease extensions. New aircraft deliveries appear less vulnerable, given the obvious fuel savings they deliver, but airframers themselves may face additional supply chain issues. Cirium will cover all these issues and more over the coming months.
Cirium Ascend Consultancy is trusted by clients across the aviation industry to provide accurate, timely, and insightful aircraft appraisals. The team provides the valuations and analysis the industry relies on to understand the market outlook, evaluate risks and identify opportunities.
Sara Dhariwal, Lead Appraiser – Helicopter & AAM Markets , Cirium Ascend Consultancy
Last week’s Cirium Ascend Consultancy helicopter market webinar examined the key forces shaping today’s rotorcraft market, from fleet growth and replacement cycles to civil‑military production dynamics, oil pricing and delivery trends.
After more than a decade of disruption, the market is showing clear signs of maturity. Long asset lives, disciplined deliveries and an ageing global fleet are supporting stability today, while also underpinning future replacement demand.
Reflecting this shift, Sarah Johnston, In‑House Counsel at SMFL Helicopters, noted that increased stability and a growing number of market participants represent “a very positive development” for the sector. Gabriella Oliveira del Mastro, Fleet Director at PHI, similarly observed that greater stability reflects a more deliberate and mature market approach.
Steady fleet growth, shaped by longevity
Over the past decade, the global civil helicopter fleet has grown at an average rate of around 1.5% per year. Growth slowed briefly in 2020 as the pandemic disrupted deliveries, but has since recovered, with expansion closer to 2% annually in recent years. By the end of 2025, the global fleet reached approximately 24,500 helicopters, representing a net increase of just over 3,200 aircraft.
Fleet growth has been supported less by elevated deliveries and more by persistently low exit rates, with retirements and total losses averaging just over 1% per year. Longevity remains a defining feature of the market, with around 90% of helicopters delivered over the past 30 years still in operation and the average retirement age approaching 40 years. While this durability underpins asset values, it has also resulted in a steadily ageing global fleet.
Replacement demand is building — but slowly
Looking ahead, replacement rather than fleet expansion is expected to be the primary driver of helicopter demand. Cirium estimates that just over 4,000 helicopters could require replacement over the next decade — equivalent to around 70% of the current global fleet. While elevated asset longevity and OEM production constraints have delayed replacement activity, they have also helped restrict supply and support asset values.
As the market evolves, a more mature secondary ecosystem is beginning to form. del Mastro noted that the helicopter sector is starting to adopt attributes long established in fixed‑wing aviation, including structured part‑out activity and lifecycle management. Echoing this, Johnston highlighted the need for stronger and more formalised secondary‑market support, underscoring the role this will play in enhancing capital efficiency and long‑term value preservation.
Civil and military demand: competition for capacity?
A recurring question is whether rising military demand is constraining deliveries into the civil helicopter market. Civil and military variants often share production lines and supply chains, making this a valid concern given the current geopolitical environment.
Historical data suggests OEMs have generally balanced production across both segments over the long term. However, the ongoing deferral of civil replacement into the latter part of this decade risks overlapping with the next anticipated military renewal cycle in the early‑to‑mid 2030s. Should this occur, pressure on production capacity and delivery lead times could intensify.
In parallel, sustained increases in military utilisation could place additional strain on shared supply chains, particularly in parts availability and MRO capacity, with potential knock‑on effects for both civil and military operators.
Oil prices: short‑term volatility versus structural impact
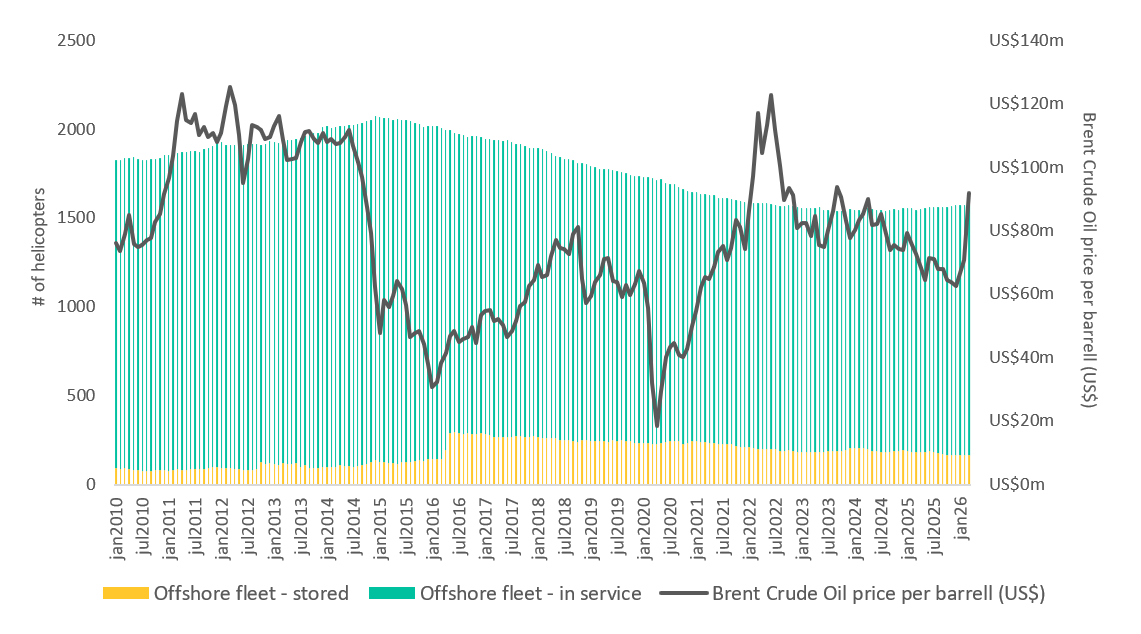
Geopolitical conflict and associated oil‑price volatility have renewed concerns about a potential downturn similar to that experienced in 2014. However, there is currently little evidence to suggest that short‑term price movements alone will materially alter helicopter fleet dynamics.
Chart 1: Offshore fleet evolution and crude oil pricing
Source: Cirium Fleets Analyzer / U.S Energy Information Administration EIA
The previous downturn was driven not by volatility, but by a prolonged period of sustained high oil prices, which encouraged aggressive fleet expansion based on assumptions of long‑term demand growth. When prices subsequently fell and remained depressed, the market was left with significant oversupply and prolonged pressure on utilisation and values. By contrast, recent pricing appears to have settled at a more sustainable level, around US$80 per barrel, historically supportive of offshore helicopter operations and a more balanced supply‑demand environment.
While broader macroeconomic risks persist — including inflationary pressures and recessionary concerns that could weigh on values and investment appetite — the key takeaway for the helicopter industry is clear: sustained structural trends matter far more than short‑term volatility.
A maturing helicopter leasing market
The helicopter leasing sector has evolved significantly since its emergence around 15 years ago. Recent consolidation has concentrated a sizeable portion of the global leased fleet among a small number of major international lessors, contributing to greater stability and a more disciplined growth profile.
Growth among established lessors has increasingly been driven by sale‑and‑leaseback transactions, rather than speculative order books, improving alignment with operator demand and reducing risk exposure. While leasing penetration remains lower than in commercial fixed‑wing aviation, there is clear scope for further expansion across multiple mission profiles, including EMS, utility, offshore energy and search‑and‑rescue operations.
Johnston described the sector as “highly dynamic and competitive”, noting that “there remains considerable headroom for additional leasing activity, both globally and across different market segments”.
del Mastro echoed this view, adding that increased competition is a positive development: “Coming from the fixed‑wing sector, where leasing choice is well established, I expect similar trends to continue developing in the rotorcraft market.”
Deliveries and the outlook for the next decade
Following delivery volumes of around 700 aircraft per year in 2023 and 2024, 2025 saw a modest decline, in line with expectations. Over the next decade, Cirium anticipates a gradual recovery, with average fleet growth of approximately 1.4% per year, equating to around 7,500 deliveries. Importantly for investors, more than half of these aircraft are expected to serve replacement demand, representing an addressable market of roughly US$50 billion on a full‑life value basis.
While extended lead times and ongoing supply‑chain constraints continue to limit near‑term deliveries, they have also reinforced supply discipline and supported asset values. From an operator and investor perspective, predictability and capital efficiency remain key priorities. del Mastro noted, “greater predictability on when aircraft can enter service is critical, alongside improved capital efficiency over the life of the aircraft and better access to competitive lease and debt financing”. She added that more predictable certification, STC processes and OEM production schedules would further enhance lifecycle optionality and returns.
New technology: complementary rather than disruptive
Emerging technologies — including autonomous helicopters, drones and eVTOL platforms — continue to attract attention. While progress is being made, their near‑term impact on the traditional helicopter market is expected to be complementary rather than disruptive.
Initial applications are likely in cargo, logistics and unmanned operations, where certification and operational barriers are lower. More complex missions will take longer to materialise, particularly where energy density, safety and regulation remain limiting factors.
A resilient market, well set up for gradual change
The helicopter sector today is defined by stability and resilience rather than rapid expansion. Long asset lives, disciplined production, diversified missions and a more mature leasing ecosystem have reduced volatility and helped stabilise values.
While supply‑chain constraints and geopolitical uncertainty remain, the overarching outlook is one of measured growth, delayed but unavoidable replacement demand, and gradual evolution rather than disruption. For operators, investors and OEMs alike, predictability, transparency and disciplined planning will be critical as we move into the next decade.
Watch the webinar on-demand
To access the presentation and watch Sara, Gabriela and Sarah’s full discussion, register to watch.
Cirium Ascend Consultancy is trusted by clients across the aviation industry to provide accurate, timely, and insightful aircraft appraisals. The team provides the valuations and analysis the industry relies on to understand the market outlook, evaluate risks and identify opportunities.
Richard Evans, Senior Consultant, Cirium Ascend Consultancy
While it is too early to predict the length or macro-level effect on the global economy of the conflict in the Middle East, we can measure the impact to-date on airline capacity, via Cirium’s Tracked Utilisation data.
At the start of 2026, Cirium Ascend Consultancy’s view was that global traffic (RPKs) and capacity (ASKs) would grow in the range of 4-6% versus 2025. This was broadly in line with the visible forward schedule, and also similar to IATA’s December 2025 Outlook, which predicted 4.9% global RPK growth.
IATA reported January 2026 traffic was up 3.8% versus 2025, on capacity up 3.5%. It has not yet reported February figures, but Cirium data shows that actual ASKs flown grew by 5.3% last month.
For March 2026, Cirium’s forward schedule, at the start of the month, indicated the airlines would expand capacity by 5.6%. This figure had already declined slightly compared to the advance March schedule at the start of the year, which showed growth of 6.8%.
Our tracked data, up to and including 22 March 2026, shows that the number of passenger flights grew by just 1.2% over the same period in 2025. Unsurprisingly, the major impact was on Middle East domiciled airlines, which have experienced a 52% decline in flights year-on-year. The region made up just 4% of tracked flights in March 2025, but it has a far larger impact in terms of ASKs, as the airlines tend to fly larger aircraft and serve longer stage lengths than in other regions. It amounts to 10% of global ASKs, based on March 2025 data.
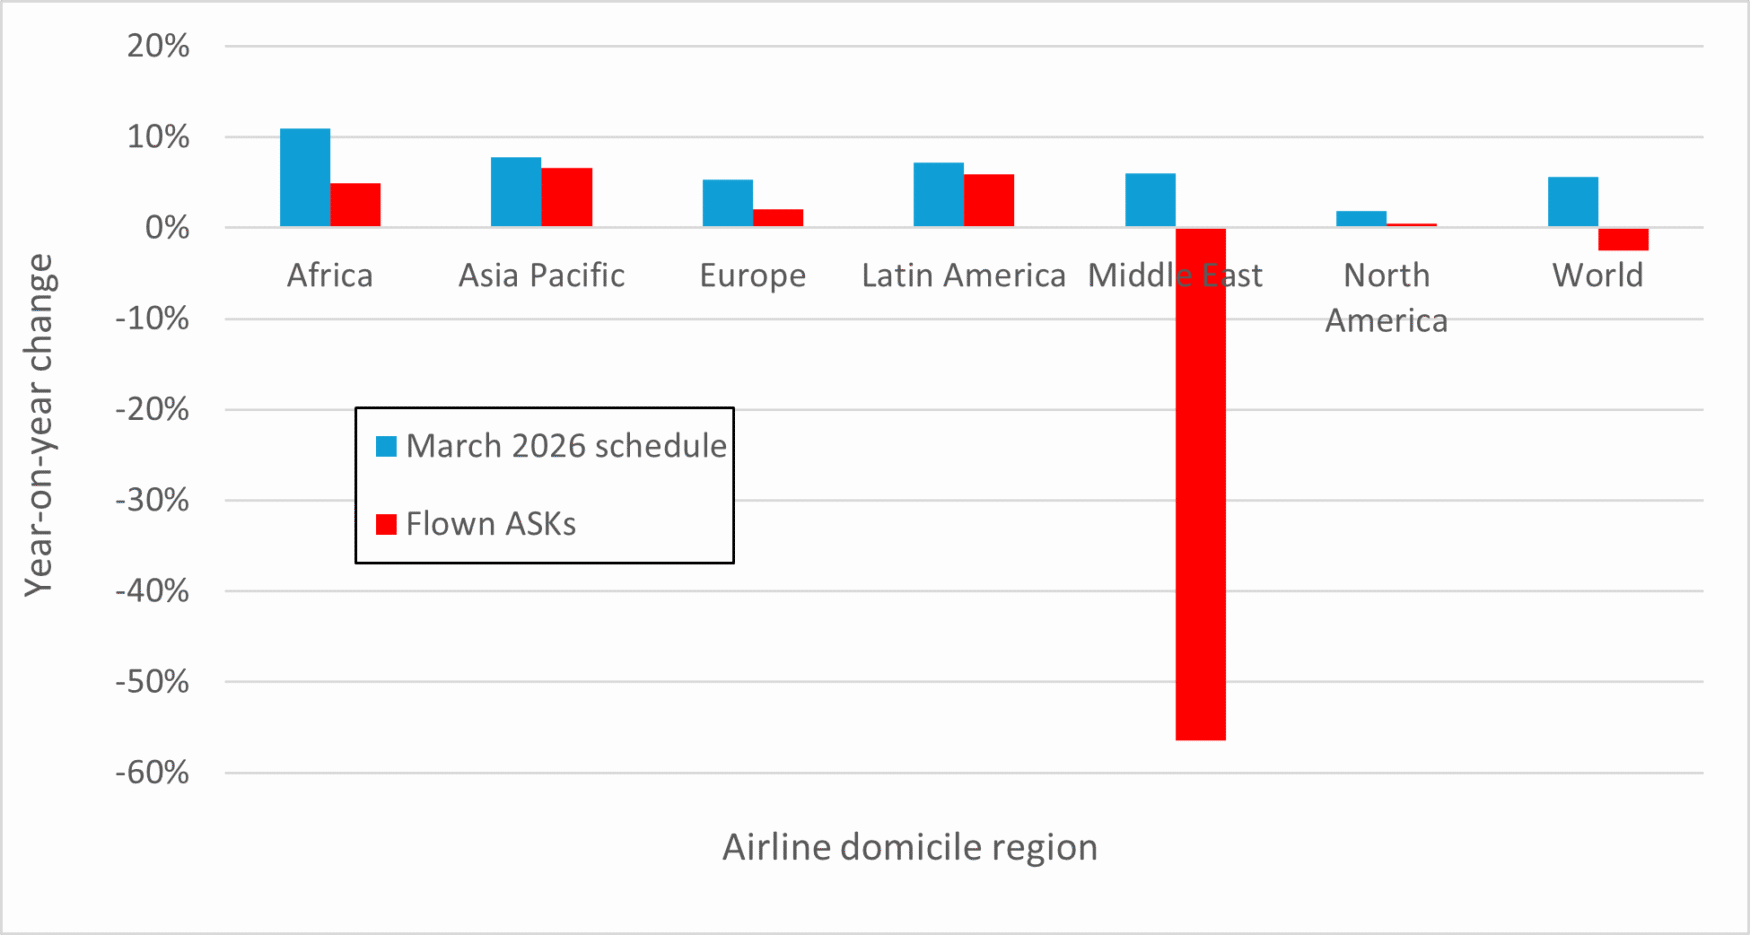
The chart below shows March 2026 flown ASKs, by airline domicile region, compared to March 2025. The 56.5% decline in Middle East airline capacity contributes to a global contraction of 2.5% in the first 22 days of the conflict.
Actual capacity flown 1-22 March 2026, versus planned schedule
Other regions are also impacted, but to a lesser degree, with many airlines cancelling flights to the Gulf states, Saudi Arabia and Israel. Comparing the forward schedule for March with the actual ASK flown provides an indication of the impact. African carriers have seen a roughly 5-6 percentage point hit, with European airlines the second most affected, with flown ASKs up 2%, versus a planned schedule increase of 5.3%. Asian carriers have experienced just a one percent impact, but this obviously varies considerably, with Indian sub-continent airlines most affected. North American airlines have seen a similar effect, with United Airlines noting that suspending its services to Riyadh and Dubai knock about 1% from its ASKs.
Looking further ahead, several airlines have announced that service suspensions to the Middle East will continue into April and May. However, the forward schedule at the time of writing has not changed dramatically. April 2026 currently shows 3.4% year-on-year growth in ASKs, compared to 5.4% immediately before the conflict started. May 2026 has fallen marginally, from 6.6% to 6.3%.
Even if passenger load-factors remain high, with strong demand in other markets stated by several airlines, the conflict has led to an eight percentage-point hit to airline capacity in March. This is before we see any measurable impact from higher jet fuel prices on demand. This level of demand/capacity disruption, if it continues for any length of time, does imply a significant effect on aircraft utilisation rates and fleet plans.
Cirium Ascend Consultancy is trusted by clients across the aviation industry to provide accurate, timely, and insightful aircraft appraisals. The team provides the valuations and analysis the industry relies on to understand the market outlook, evaluate risks and identify opportunities.
George Dimitroff, Head of Valuations, Cirium Ascend Consultancy
As the world tries to grasp the consequences of the escalating conflict in Iran and the wider Middle East, the following sets out Cirium Ascend Consultancy’s early thoughts.
The conflict affects aviation in three ways:
Airspace closures
Rising fuel prices
Potential for softer demand – both in the region and globally
Airspace closures
These are already affecting the big three Gulf carriers severely (Emirates, Qatar Airways, and Etihad Airways) but there is risk they may extend to others such as Oman Air, Saudia or beyond
20% of all passengers travelling between Europe and Asia-Pacific (incl. Australasia) in 2025 travelled on Middle Eastern carriers – that is 1 in 5 passengers
10% of all US passengers travelling to Asia-Pacific go through the Middle East hubs.
Direct flights from Europe to Asia are also affected because they are now limited to just one narrow corridor over Georgia and Azerbaijan, or a longer southern route around Saudi Arabia which adds flight time and fuel burn
If Azerbaijan airspace were to close it would put even greater pressure on long-haul flights between Europe and Asia-Pacific, except for those airlines that can overfly Russian airspace (Chinese and Indian carriers, for example)
A significant portion of passenger traffic that passes through ME hubs may now decide to avoid the risk of connecting there and book direct flights to their destinations. This could have a positive uplift for European and Asian carriers and could increase demand for long range widebody aircraft especially Airbus A350s, and Boeing 777s and 787s. However, such upside may not materialise if European and Asian economies suffer as a result of higher energy costs and overall demand for travel is affected
Rising fuel prices
The price of a barrel of oil spiked from $60 in January to already exceed $100 – a more than 50% increase
While peace negotiations could lead to Brent crude oil prices easing modestly in April, energy information provider ICIS anticipates a “gradually declining but persistent risk premium to remain embedded in prices for the remainder of the year, reflecting continued uncertainty around regional stability”
Crack spreads are increasing, meaning Jet A1 fuel is affected even more
US airlines are completely unhedged when it comes to fuel price. Southwest Airlines was one of the last to abandon its hedging programme a year ago (March 2025)
European and Asian airlines are much better hedged – many have between 45% and 85% of their needs for at least H1 2026 hedged at around $60/bbl or less, some even until the end of the year:
Hedged airlines include (but not limited to) Air France-KLM, Air New Zealand, Cathay Pacific, China Eastern, EasyJet, Finnair, Icelandair, Lufthansa, Norwegian, Qantas, Ryanair, Singapore Airlines, Virgin Australia and Wizz Air
Hedged airlines will be much less exposed to fuel price increases, while US carriers likely to be impacted harder
Some carriers hedge against crude, others Jet A – crude hedges still leave partial exposure to crack spread
Cirium analysis and modelling shows that the global airline industry stops making profit (i.e. breaks even) somewhere between $72 and $76 per barrel (sustained, longer term), depending on assumptions. Above that fuel price the industry starts to make losses
With higher fuel prices there are two implications to demand for aircraft
A greater push for newer-generation, more fuel-efficient aircraft
Increased reluctance for airlines to extend leases for previous-generation aircraft or to retain owned aircraft in service for longer
In some cases, the increased fuel costs may pressure airlines to offer less in lease rental especially for out-of-production aircraft
Potential for softer demand
There is currently a serious risk of Asian, and to a lesser extent European economies, being affected by both higher energy costs and possibly fuel shortages if the Strait of Hormuz remains de facto closed for longer, and stockpiles run dry
For the past few years, we have considered many scenarios that are focussed on aircraft supply increasing to meet demand. For the first time in a while, we must consider the risk of a drop in demand as something increasingly plausible, potentially occurring sooner than expected. This could be especially critical as the manufacturers are making their biggest ramp-up in production over the next three years or so
If the conflict extends beyond the next month or two, the risk of an impact on air-travel demand becomes exponentially greater, and could firstly start to impact aircraft lease rates, and eventually aircraft values with previous-generation, out-of-production types being more vulnerable
Airlines operating older, less-fuel efficient widebodies on long-haul services would be worst affected, unless they are hedged at low levels
Aviation enters 2026 with momentum, experiencing resilient demand, persistent supply‑side constraints and an increasingly uncertain macroeconomic environment.
In The 2026 Aviation Market Outlook broadcast live on 4th February 2026, Stephen Burnside, Richard Evans and Daniel Hall explored the key factors shaping the sector to unpack what this means for airlines, lessors and the wider industry.
Mixed macro signals leave less room for error
From a macroeconomic perspective, the headline indicators point to an environment that supports air travel demand. Purchasing managers’ indices (PMIs) remain high, key economies are growing, and productivity metrics are rising sharply – all good news for the aviation industry. As Stephen Burnside noted, “PMIs are doing great… if it’s above 50%, we’re expanding,”
However, consumer sentiment is weakening, and external shocks threaten to create abrupt economic corrections. “The US is central to our 2026 outlook… we like to keep a very close eye on the US because it does really drive the entire world economy” Stephen explained, adding that the impact of a US policy error impacting trade and undermining economic growth was the “number one risk for our outlook for 2026”. While aviation enters 2026 with momentum, the industry has less margin for error. With debt‑to‑GDP ratios elevated and geopolitical tensions unresolved, any shock could have a faster and more pronounced impact than in previous cycles.
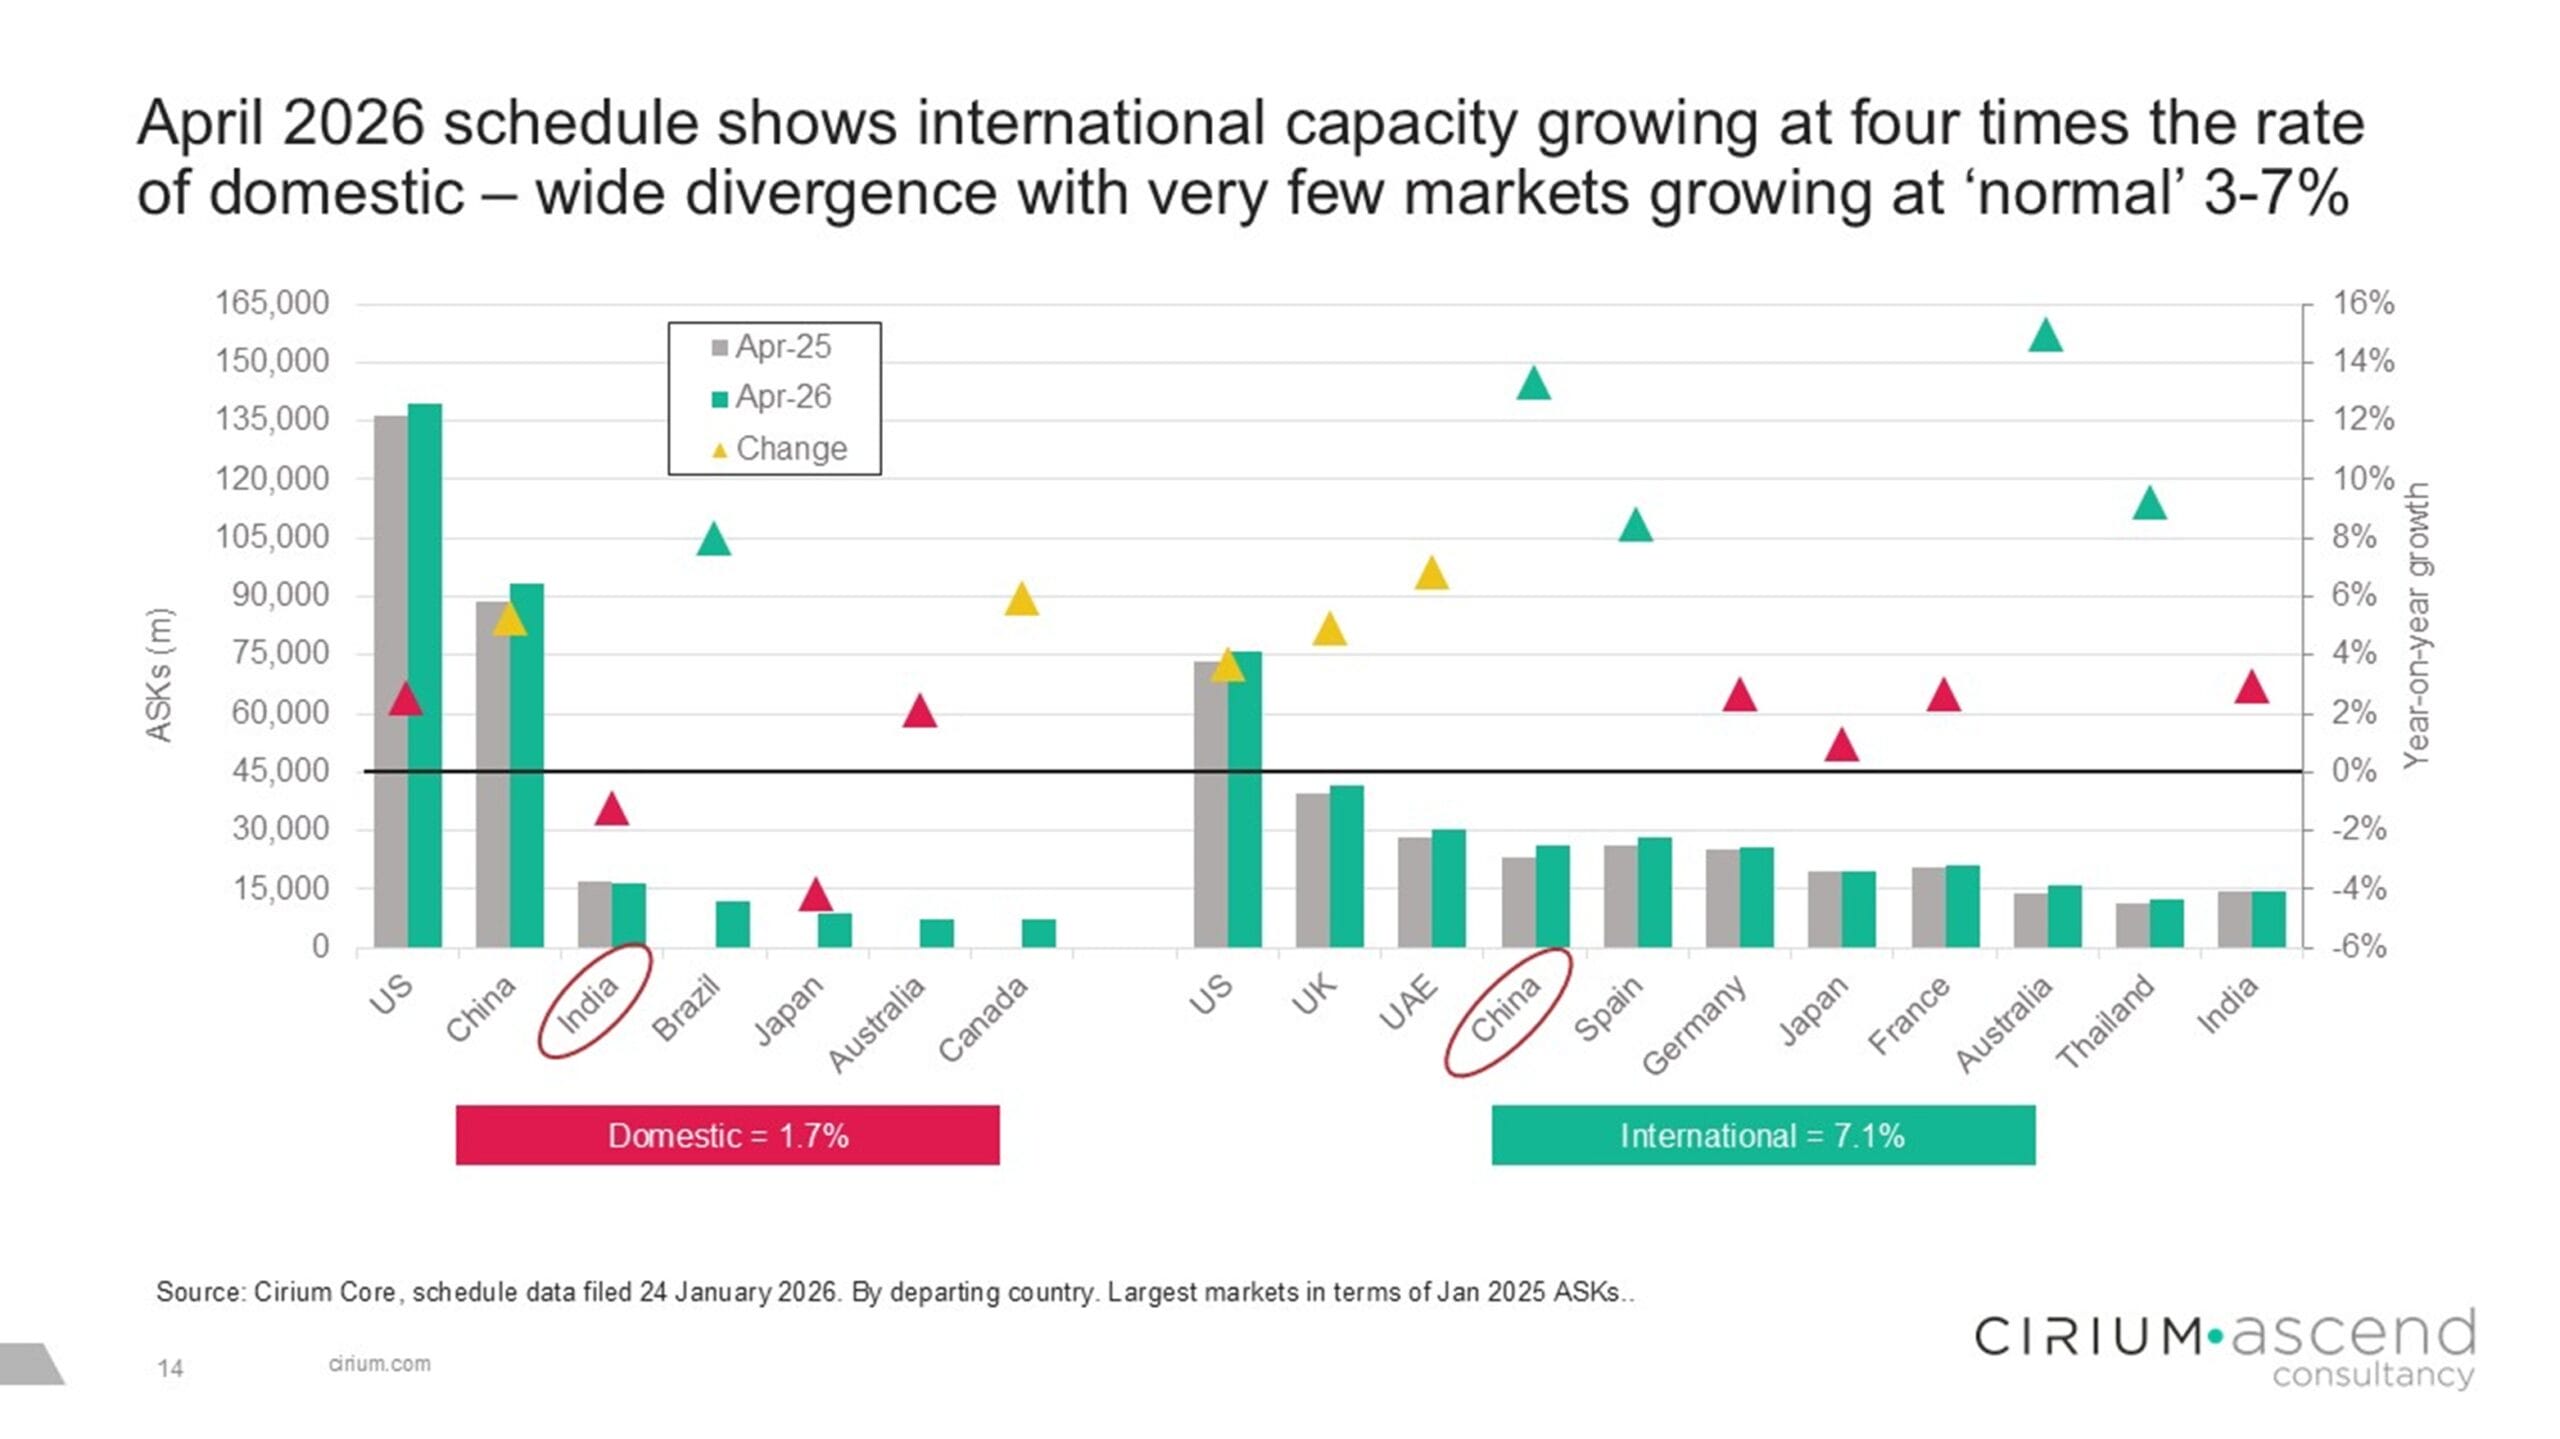
Demand and capacity appear balanced – regional divergence tells a different story
After years of disruption and recovery, 2025 marked a return to more conventional aviation market dynamics. Globally, demand and capacity were closely aligned, with only marginal changes in load factors. “If you just stood above, if you didn’t know anything else, you’d say well demand and supply look fairly in balance,” observed Richard Evans, highlighting how far the industry has come since 2019.
That balance, however, hides a widening gap between regions, markets and segments. Forward schedules show continued growth into 2026, but at a more measured pace, and with clear divergence by geography. Asia‑Pacific, the Middle East and Africa continue to see demand outpacing supply, while North America and Latin America experienced load factor declines earlier in the year.
This unevenness is set to persist in 2026. International capacity is growing far faster than domestic, while some major markets are barely expanding at all. Airline performance will depend on “whether the market is growing strongly or not, but within that what the balance of competition is and the opportunities for yield expansion on the international side.”
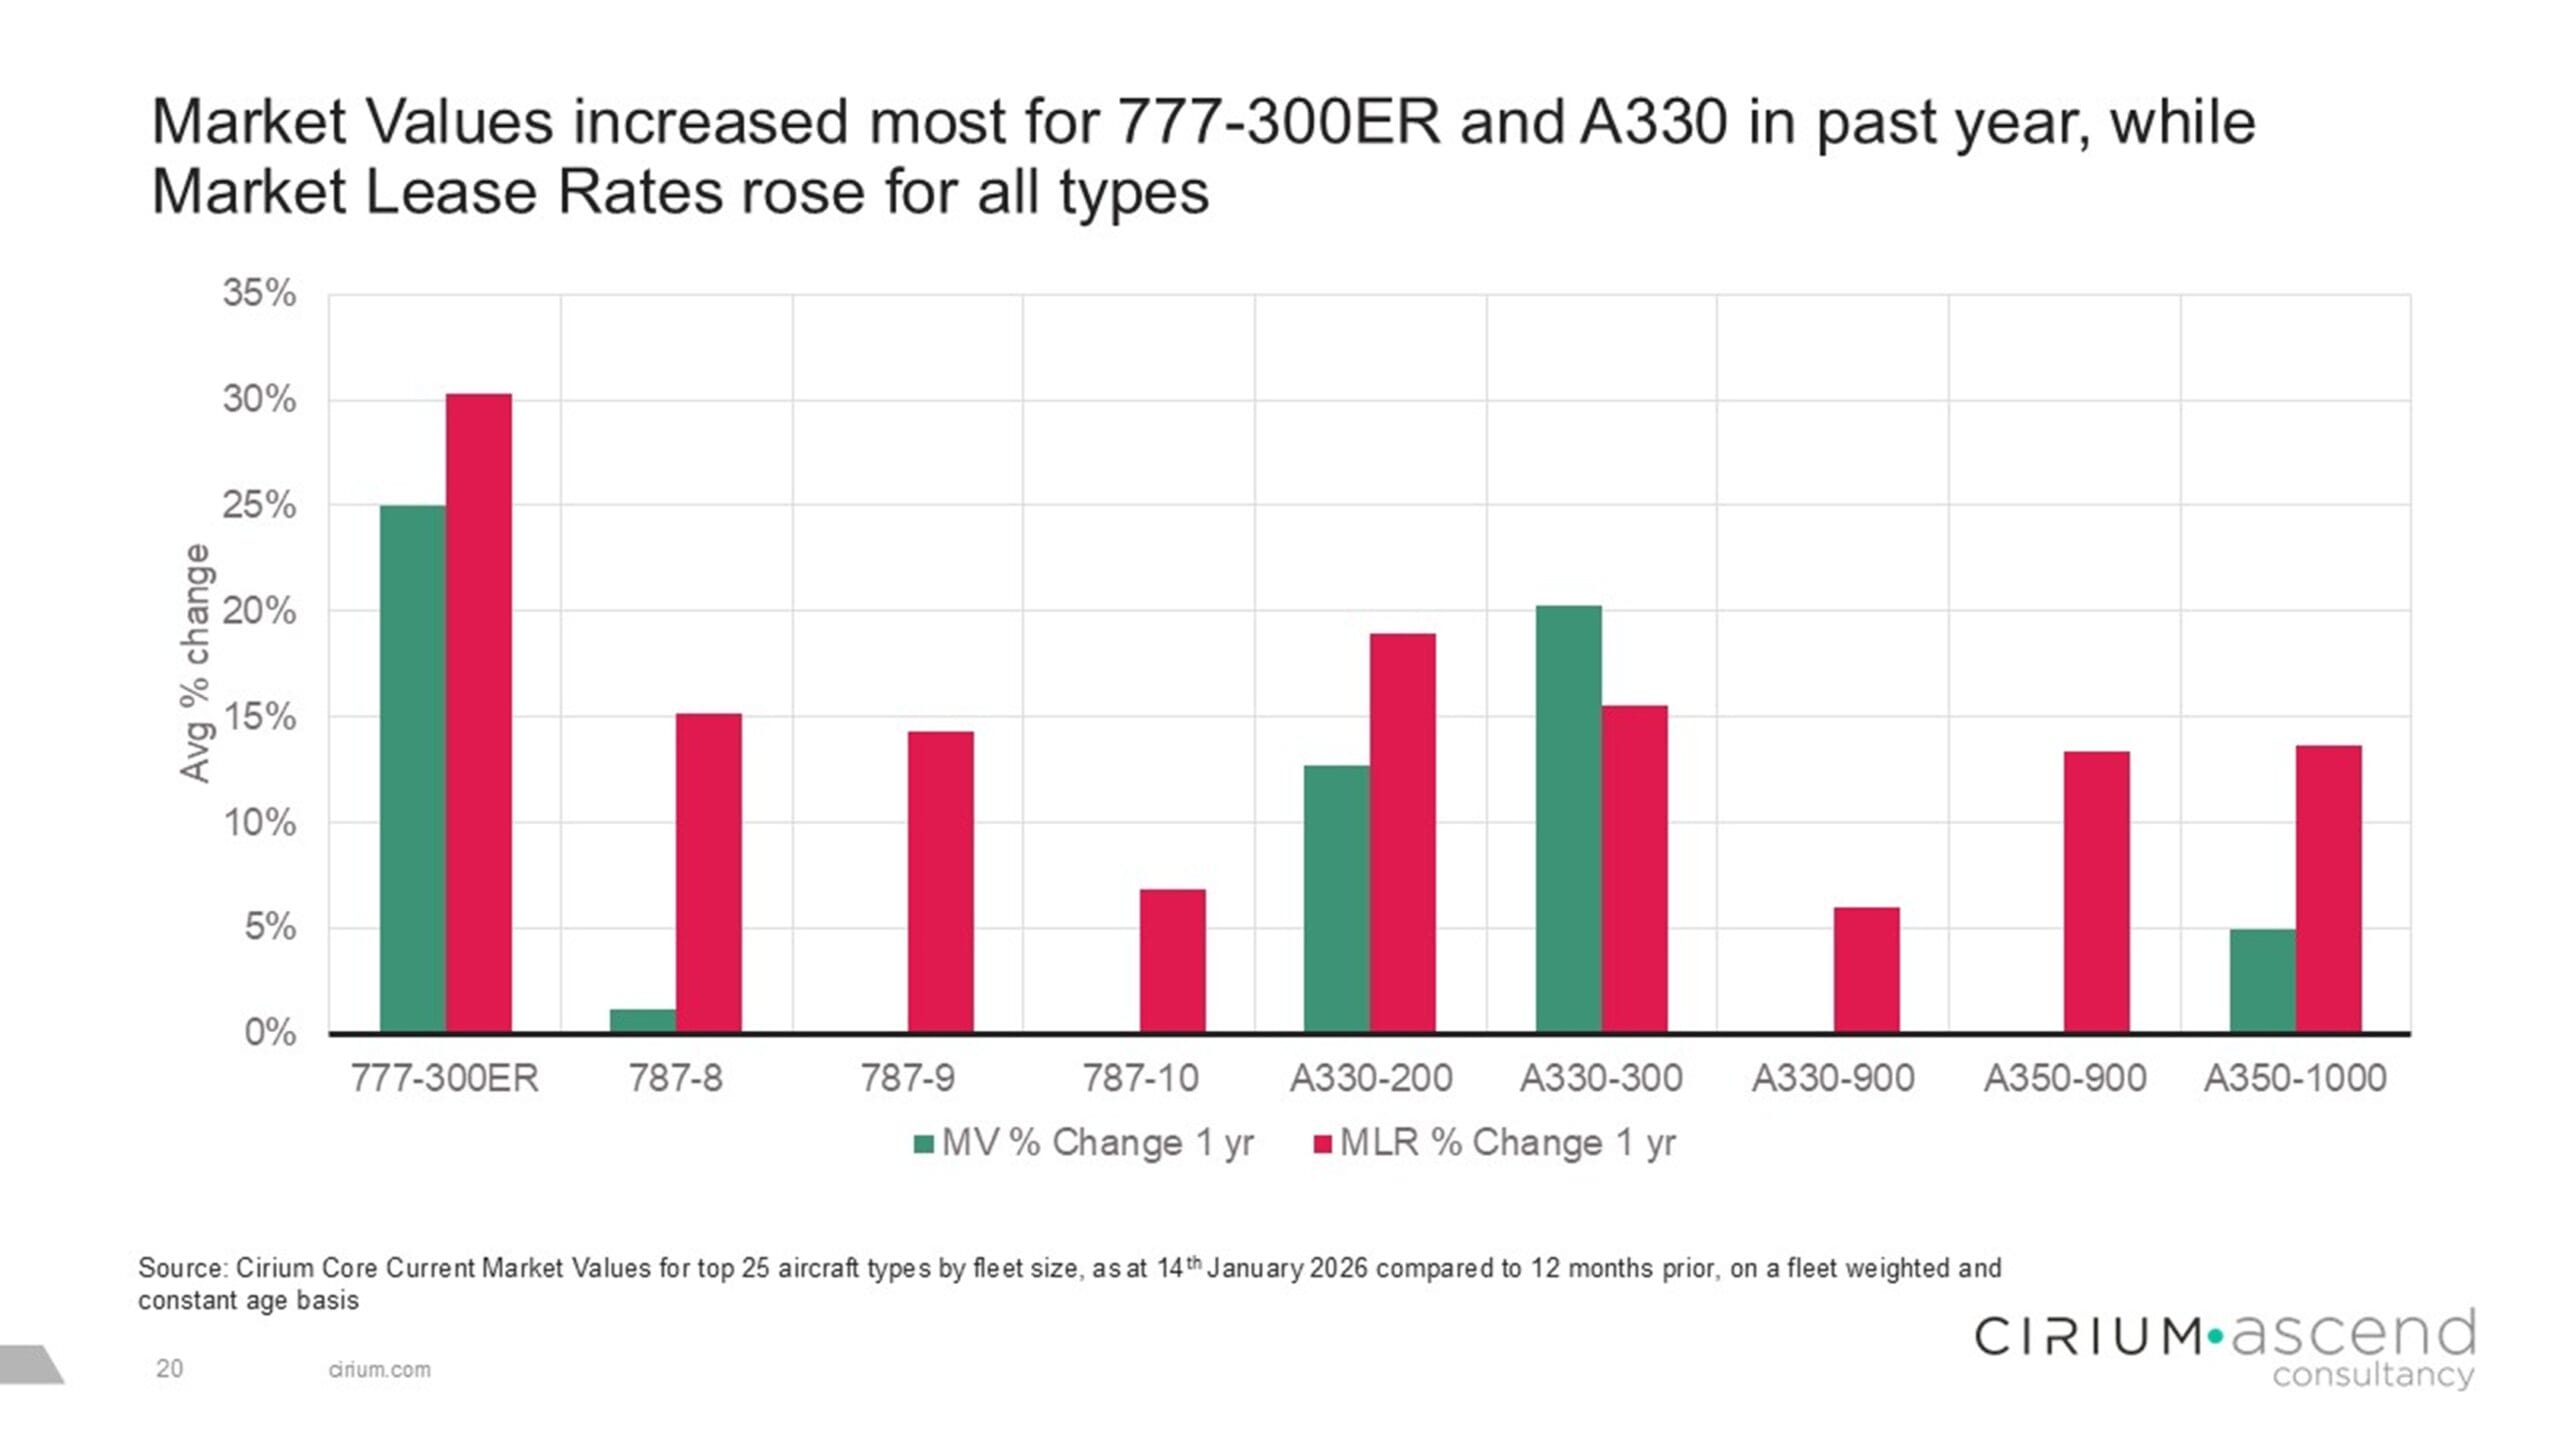
Aircraft and engine values stay elevated with widebodies scarce
Tight supply conditions continued to support aircraft and engine values through 2025, with diverging dynamics between segments. After years of suppressed production, widebody availability is now extremely tight as international demand has fully recovered.
By contrast, the single‑aisle market has moved into a more stable phase, with market values rising only modestly over the past year and lease rates largely unchanged, reflecting improving production visibility and a highly competitive lessor landscape despite ongoing engine‑related constraints.
In the widebody market, Daniel Hall pointed to twelve months of growing market values, and lease rates rising by more than 14% on average last year. “If you speak to a lessor today and try and get your hands on a widebody under 15 or 20 years of age, I believe there are none available today.” This is pushing airlines to invest heavily in twin-aisle cabin refurbishments and sustaining pricing power for lessors and owners. While production rates are improving, they are not picking up fast enough to rebalance supply and demand in the next twelve months. “We expect similar this year, but maybe at a smaller magnitude; we have to look at the bigger picture” pointing to another year of lease rate growth.
Watch the webinar on-demand
To access the full presentation, including analysis of the impact of the GTF engine issues on single‑aisle capacity, fleet availability and lease‑rate dynamics, register to watch the webinar.
With an impressive on-time departure rate of 91.47% across 34,068 tracked flights, GYE demonstrated exceptional consistency while serving 19 routes. This achievement underscores the airport’s ability to deliver world-class performance in a category defined by airports handling between 5 million and 15 million seats annually.
The qualification criteria for this award emphasize comprehensive flight operations and reliability, ensuring recognition for airports that balance regional connectivity with global service standards. GYE’s success is particularly notable given the operational challenges of 2025, including scheduled runway maintenance closures in September that required temporary suspension of all flight operations. These proactive infrastructure upgrades highlight the airport’s commitment to long-term safety and efficiency, even as it maintained industry-leading punctuality throughout the year.
Small airports often face unique constraints, managing diverse route networks while maintaining reliability.
GYE’s achievement reflects strategic coordination among airlines, ground handlers, and air traffic control, enabling seamless travel experiences despite seasonal disruptions.
Its performance outpaced strong contenders such as El Salvador International Airport (SAL), which posted an on-time departure rate of 90.28% across 47,203 flights and 34 routes, and Rio de Janeiro’s Santos Dumont Airport (SDU), which achieved 89.67% punctuality with 58,303 flights and 7 routes. These results highlight the growing emphasis on reliability in Latin America, a region where operational resilience is increasingly critical.
Beyond Latin America, airports like Stavanger (SVG) and Cape Town (CPT) also demonstrated competitive performance, signaling a global trend toward process optimization and technology-driven efficiency. For travelers and airlines alike, this translates into fewer delays, improved connectivity, and enhanced confidence in regional gateways. The top five airports in this category collectively illustrate how smaller hubs are leveraging innovation and disciplined operations to deliver world-class punctuality.
Looking ahead, Guayaquil’s leadership in this category illustrates how smaller hubs can achieve excellence through strategic investment and operational rigor. As the aviation industry continues to navigate evolving challenges,
GYE stands as a model of success, proving that size does not limit the ability to deliver superior performance.
Running an airline anywhere is a tricky undertaking, but doing so in the Middle East and Africa (MEA) brings its own unique challenges. Hot and harsh conditions result in vast maintenance requirements for engines and equipment. Aircraft often spend far longer on the ground than in more temperate regions. Then, this year at least, there has been vast geopolitical disruption. Meanwhile competition is fierce. But there are advantages too. The Middle East’s position at the centre of the world makes it an ideal transfer location for the Gulf carriers, who funnel vast numbers of people around the globe, particularly between Europe and Asia. Their stellar earnings since the pandemic are a testament to the success of this strategy.
Alongside this, the region is seeing an explosion in air travel demand to, from, and within it. The domestic Saudi Arabian route from Jeddah to Riyadh, for example, is set to become the busiest air corridor in the world by the end of the decade, industry insiders believe, and perhaps well before that.
IATA, notably, says that at $29, profit per passenger will be higher in the Middle East next year than anywhere else. That compares with just $7.90 globally.
Aviation in Africa lacks the scale of its Middle Eastern rivals. The continent’s airlines lament the extra costs of doing business which includes higher prices for leases, MRO, fuel and insurance. Then there are the wild swings of local currencies, stranded earnings, and problems in retaining skilled staff – many of whom are wooed by the deep pockets of the Gulf. Yet, as the rankings show, there are successes here too, underpinned by an emerging middle class that is seeing Africans fly at scale for the first time.
Topping this year’s OTP rankings is South Africa’s Safair.
Following closely are Aeromexico, Gol, Azul, and LATAM Airlines, reinforcing the region’s reputation for reliability and efficiency.
Long a leader in performance, Safair has developed a reputation for precise scheduling and rapid 30-minute turnarounds as befit its low-cost business model, with a heavy use of real-time data. Alongside this, built-in contingency planning enables them to bounce-back rapidly when disruption does occur.
It notes that its performance has been underpinned by “strategic investments” in advanced scheduling, as well as “data-driven decision-making, and fleet management practices.”
Meanwhile the use of a single aircraft type – the Boeing 737 – has helped to keep maintenance costs down and reduce complexity, enabling flexibility between crews and bolstering utilisation rates. This all filters through to its reliability.
Safair has also embedded OTP into its corporate culture, linking employee incentives to their achievements and making it a key performance indicator, meaning that all staff are focussed on getting flights out on time.
Close behind is Royal Jordanian. The carrier is undergoing a strategic shift towards inbound tourism and becoming the main player in the Levant region. “That’s obviously a market which we want to dominate in the future,” commercial chief Karim Makhlouf said in November.
It plans a fleet expansion from around 23 aircraft currently to 41 by 2028, amid a longer-term goal of 52 by 2032. Passenger numbers are targeted to grow from 3 million to 7.1 million by 2028.
Makhlouf added that amid a growth spurt and restructuring it is “super difficult” to make money, but that it had recently reported a nine-month sustainable profit of around $43 million, “which for an airline like Royal Jordanian is quite a significant achievement.”
Luis Felipe de Oliveira, Executive Director and CEO, Exactly Consulting and Services SARL
Beyond growth, Latin America is setting benchmarks in operational excellence. Aeromexico stands out globally, achieving the best On-Time Performance (OTP) among the Global Airline Category, a remarkable feat given its operations from the highly congested Mexico City International Airport. This achievement highlights resilience and world-class standards in a challenging environment.
Regionally, Copa Airlines continues to lead OTP rankings, building on its stellar 2024 performance.
Following closely are Aeromexico, Gol, Azul, and LATAM Airlines, reinforcing the region’s reputation for reliability and efficiency.
Airports mirror this success, demonstrating the strong correlation between airline and airport punctuality. Santiago Arturo Merino Benitez International Airport leads all Large Airports globally, while two other Latin American airports feature in the top 10 of this category. The Medium-sized Airport Category shines even brighter: Tocumen International Airport in Panama claims the top spot worldwide, with five regional airports among the global top 10. In the Small Airport category, Guayaquil Airport leads globally, supported by four Latin American airports in the top ten.
Congratulations to the winners.
These results are more than operational metrics, they are a testament to the region’s commitment to excellence and its role in driving social and economic development. With robust growth, outstanding efficiency, and unparalleled OTP achievements, Latin America is not just keeping pace with global aviation, it is setting new standards.
The region’s vast and diverse landscape offers immense opportunities, and its aviation sector is poised to be a cornerstone of connectivity and progress for years to come.
Our team at Cirium spent months analyzing this relationship across three distance bands: short-haul routes under 1,500 kilometers, medium-haul between 1,500-3,999 kilometers, and long-haul over 4,000 kilometers. We compared July 2019 operations with July 2024. The Cirium EmeraldSky platform let us track 47 operational variables across more than 100,000 daily flights. Everything from gate times and runway waits to specific aircraft configurations and passenger loads.
The correlation was consistent where operational changes occurred.
Routes with improved on-time performance showed measurable drops in flight times and emissions.
Routes with declining OTP showed the opposite: longer flights and higher emissions. The pattern held across different airlines and aircraft types.
Most emissions calculators rely on simple distance formulas. We’re tracking actual operational data. The factors that determine real fuel consumption. PwC independently verified the methodology to ISAE 3000 standards, which puts it among the most rigorous publicly available datasets on airline emissions.
Why Delays Create More Emissions
The mechanism is straightforward but often overlooked. Delayed aircraft burn fuel while accomplishing nothing productive. They sit on taxiways with engines running, waiting for clearance. They circle in holding patterns before landing. They take longer routes to dodge congestion.
Researchers Brueckner and Abreu quantified this over a 21-year study of 16 US airlines.
Each percentage point increase in flights delayed more than 15 minutes correlated with a 0.3% jump in fuel consumption and emissions.
In practice, an airline cutting its delay rate from 22% to 19% (just three percentage points) reduces fuel consumption by roughly 1%. The airlines in that study burned 13.7 billion gallons of jet fuel in 2015. At standard carbon pricing, a three-point improvement delivered $48 million in annual environmental benefits. It’s measurable impact from better operations.
Ground Operations Tell the Story
Much of the emissions penalty happens before takeoff. European air traffic management analysis (2015-2017) found that routing inefficiencies make flight paths 0.61-0.76% longer than optimal. That translated to 229,000 extra tonnes of fuel and 721,000 additional tonnes of CO₂. The equivalent of four full days of flying across the European Economic Area.
At London Heathrow during peak hours, about half the arriving aircraft enter holding patterns averaging six minutes each. During one January 2015 peak hour, those holding patterns alone produced 10 tonnes of CO₂ and 114 kilograms of nitrogen oxides.
The 20 most congested US airports generate 6 million metric tonnes of CO₂ annually just from aircraft taxiing. Research shows that eliminating taxi delays could cut overall flight fuel consumption by 1% on average, with some congested airports showing potential reductions up to 2%.
Solutions That Already Work
Continuous Descent Operations let aircraft descend smoothly with minimal engine thrust instead of the traditional step-down approach with level flight segments.
This saves an average of 51 kilograms of fuel per flight, with real-world operations achieving 3.6% fuel burn improvements.
Full deployment across Europe could deliver 350,000 tonnes in annual fuel savings.
Airport Collaborative Decision-Making systems create transparent communication between airlines, ground handlers, and air traffic control. When 17 European airports put these platforms in place in 2016, they saw 7% reductions in taxi time, 10.3% drops in air traffic delays, and 102,700 tonnes of CO₂ saved.
The Gap Between Airlines
The airline industry improved its carbon output per passenger by 12% between 2013 and 2019.
Roughly 2% per year. The variation between carriers tells an interesting story. Our 2024 Flight Emissions Review shows low-cost carriers like Wizz Air (53.9 grams CO₂ per available seat-kilometer) and Frontier (54.4 g CO₂/ASK) substantially outperforming legacy carriers.
How they run their operations explains much of this gap. Low-cost carriers typically maintain higher load factors, operate uniform fleets, fly point-to-point networks, and refine procedures more rigorously. These same factors support both on-time performance and efficiency.
Why the 3% Matters Right Now
Getting aviation to net-zero by 2050 depends heavily on sustainable aviation fuels (65% of the solution) and new propulsion technologies (13%). Operational improvements? Just 3% of the long-term plan.
Sustainable fuel production won’t reach meaningful scale until the 2030s. Hydrogen and electric aircraft remain years away from commercial deployment. That makes the 3% from operational improvements the only immediate option for emissions reduction.
Better operations are the immediate option for emissions reduction.
No new technology required, just better execution of existing procedures.
When an airline publishes its on-time performance statistics, it’s revealing more than customer service quality. Those numbers provide a window into how well the airline runs, and that directly affects environmental impact. The data proves the connection. Better on-time performance means lower emissions per passenger. It’s something airlines can improve right now.
Report highlights
If you haven’t read the complete 2024 EmeraldSky Flight Emissions Review, you can download it at the link below. We’re releasing the 2025 edition in early 2026. If you’d like early access when it’s available, scan the QR code below to register your interest and we’ll send it your way.
Cirium EmeraldSky Study (2024): Short-haul route analysis comparing July 2019 to July 2024 operations, tracking 47 operational variables across 100,000+ daily flights. Methodology independently verified to ISAE 3000 standard by PricewaterhouseCoopers.
Brueckner, J.K., and Abreu, C. “Airline Fuel Usage and Carbon Emissions: Determining Factors.” Journal of Air Transport Management, Vol. 62 (2017), pp. 10-17. Study of 16 US airlines over 1995-2015 period.
EUROCONTROL Performance Review Reports (2015-2017): European air traffic management inefficiency analysis, horizontal flight efficiency data, and holding pattern emissions studies.
EUROCONTROL A-CDM Impact Assessment (2016): Analysis of 17 European airports implementing Airport Collaborative Decision Making systems. Study developed by Atlas Chase for EUROCONTROL.
Cirium Flight Emissions Review (2024): Global airline emissions rankings using flight-specific operational data. Published July 2025.
IATA Global Aviation Data (2013-2019): Historical carbon intensity trends for commercial aviation.
Air Transport Action Group (ATAG): Waypoint 2050 (2nd Edition, September 2021). Aviation industry net-zero pathway analysis and decarbonization scenarios.
Jay Morgan, Director, Professional Data Services, Cirium
Defining the Medium Airport Category
Medium airports, as classified in the Cirium OTP program, serve between 15 and 25 million seats per year and must meet stringent data coverage requirements. Only airports with at least 80% actual gate departure coverage and full award qualification are considered for the rankings, ensuring a level playing field and reliable benchmarking.
PTY’s Standout Performance
In 2025, PTY secured the number one spot in the medium airport category, achieving an impressive [93.34%] on-time departure rate. This figure is supported by a remarkable 99.49% tracked flight coverage, underscoring the reliability of the data and the airport’s operational discipline. PTY’s “B0%” metric—representing the share of departures with zero recorded delay—stood at 68.57%, further highlighting its commitment to punctuality.
The airport’s scale and connectivity are also notable. PTY served 95 routes across four regions, with 19 airlines operating a total of 148,065 flights during the period. Its total seat count for the year reached 24.46 million, placing it firmly within the medium airport band while maintaining broad international reach.
Context Among Peers
PTY’s closest competitors in the medium airport category included Brasília International Airport (BSB) and Johannesburg O.R. Tambo International Airport (JNB), with on-time departure rates of 88.36% and 86.22%, respectively. While these airports demonstrated strong performance, PTY’s margin of excellence was clear, driven by both high punctuality and comprehensive operational coverage.
Key Takeaways
The recognition of PTY’s outstanding performance, underscored by a 93.34% on-time departure rate, demonstrates the tangible benefits of operational discipline and strategic investment in reliable infrastructure.
Such consistent punctuality is not achieved by chance, but through a concerted effort across multiple facets of airport management—ranging from proactive maintenance and real-time resource allocation to close collaboration with airline partners and ground service providers.
Leveraging advanced analytics and comprehensive data coverage, PTY has been able to identify trends, anticipate operational bottlenecks, and implement timely interventions that prevent minor disruptions from escalating into significant delays. This data-driven approach fosters a culture of continuous improvement, where every success is examined for scalability and every setback becomes a lesson for future resilience.
Looking ahead, airports striving for similar results can draw on PTY’s example, recognizing that the pathway to excellence lies in combining technological innovation with human expertise. As global air travel continues its post-pandemic recovery and new challenges such as sustainability, passenger expectations, and fluctuating demand emerge, the ability to reliably deliver high standards of punctuality and service will become even more critical. By embracing best practices in data management, operational transparency, and stakeholder engagement, other airports can position themselves to not only match but surpass established benchmarks, ultimately enhancing the travel experience for millions of passengers worldwide. In this evolving landscape, PTY’s achievement stands as a testament to what is possible when vision, discipline, and adaptability come together in pursuit of operational excellence.