Category: Industry

  • The outlook for airline capacity and slot allocation

    Herman Tse, Valuations Manager, Cirium Ascend Consultancy

    The 157th IATA Slot Conference, scheduled to take place in Lisbon, Portugal from 18–20 November 2025, will serve as a pivotal forum for stakeholders in the aviation industry to address slot allocation and capacity management for the Northern Summer Season, spanning 26 March to 25 October 2026. As the industry continues its recovery and expansion in the post-Covid era, several factors including geopolitical tensions and ongoing aircraft supply constraints could pose potential challenges to sustaining growth momentum. This article examines the key themes likely to shape discussions at the conference and provides an outlook for airline capacity planning in 2026.

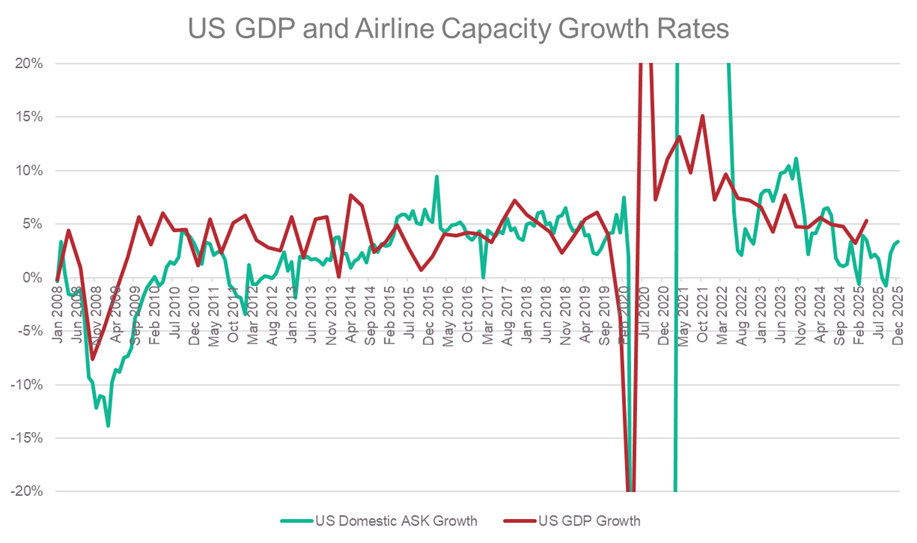
    Historically, global GDP growth has exhibited a strong positive correlation with air-travel demand. As economies expand, rising disposable incomes enable more individuals to afford air travel, while businesses increase travel budgets during periods of economic prosperity. Consequently, GDP growth is a critical indicator for forecasting future passenger demand. Recent data shows that entering the fourth quarter of 2025, developing economies such as India and China have demonstrated notable improvements in GDP growth forecasts. The USA, after experiencing a trough in mid-2025, has rebounded to near 2% growth. Looking ahead to 2026, global GDP growth is projected to range between 2.4% and 3.1%, according to leading economic institutions and intergovernmental organizations. This positive macroeconomic outlook underpins a favourable forecast for air travel demand in 2026.

    Chart 1: Development of 2025 GDP growth forecast

    Source: EIU, World is calculated at Market Exchange Rates

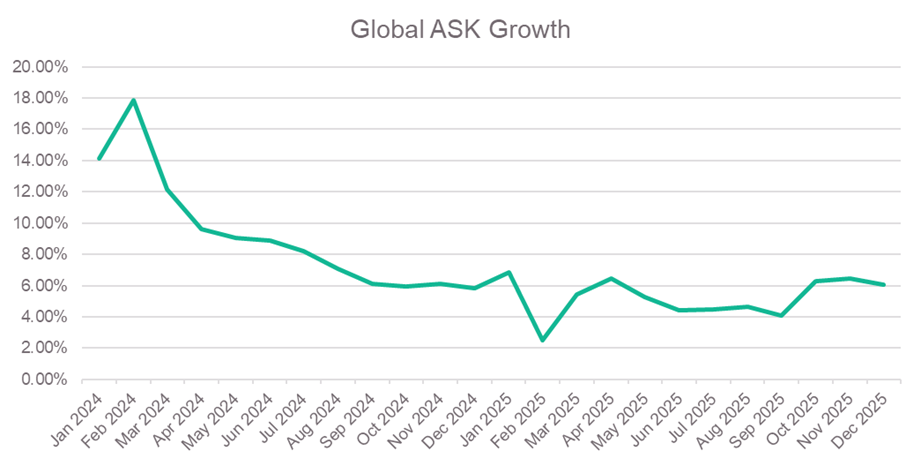
    Cirium flight schedules reveal that global airline seat capacity has been on a steady upward trajectory since early 2024, with all regions recording positive growth in 2025. The Asia-Pacific region stands out, driven by robust domestic demand, particularly in China and India. However, further recovery in this region is contingent upon the resolution of geopolitical issues, such as the China-US relationship and Russian airspace overflight restrictions. The Middle East continues to solidify its role as a strategic hub for long-haul traffic between Asia, Europe, and Africa. Notably, some European carriers have scaled back operations in the Chinese market due to competitive disadvantages stemming from Russia overflight constraints, which favour Chinese operators.

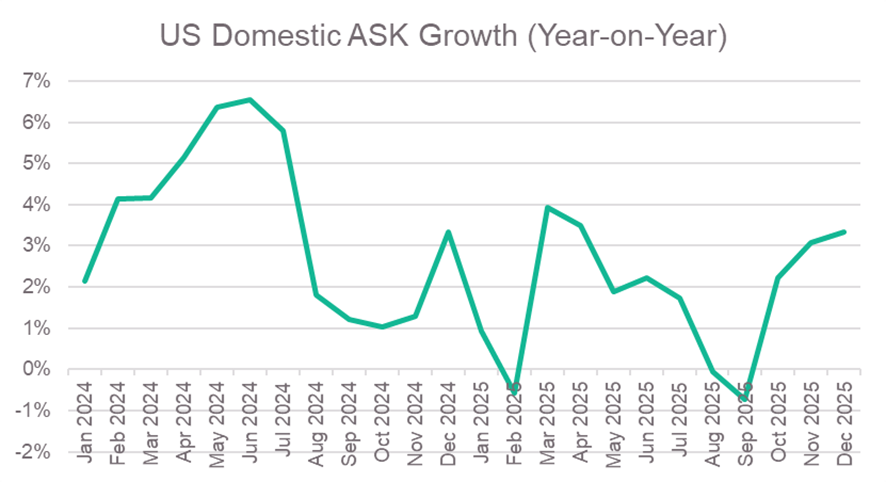
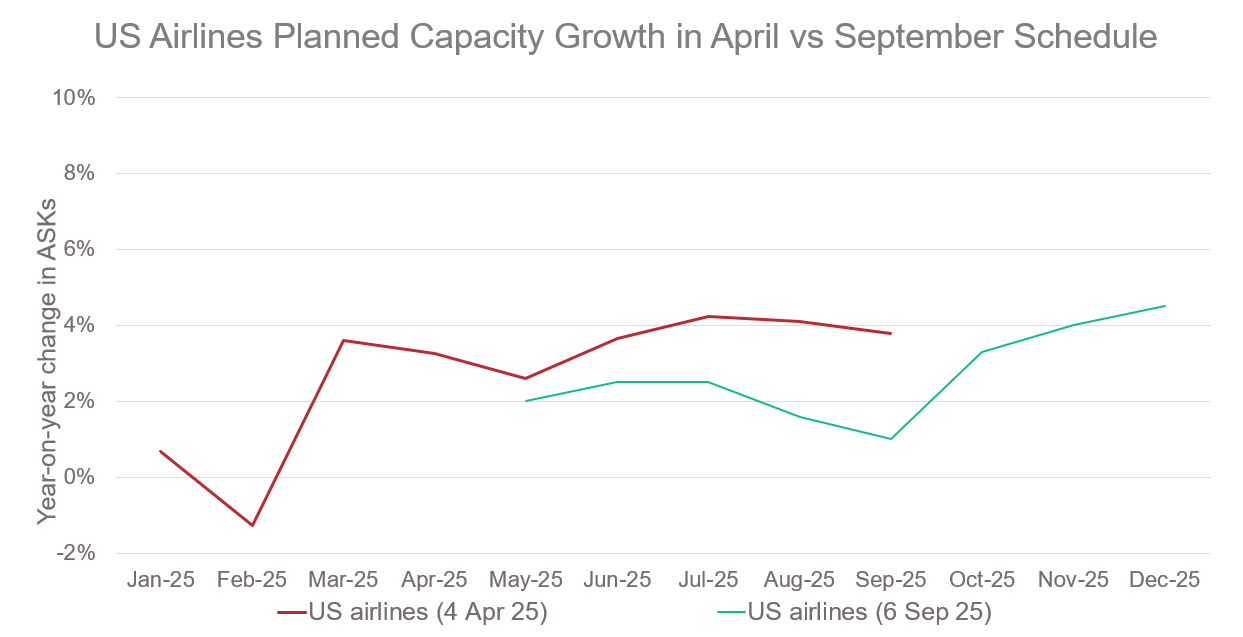
    Europe is also experiencing strong growth in both regional and international seat capacity, propelled by the resurgence of leisure travel, visiting friends and relatives (VFR) traffic, and the expansion of low-cost carriers (LCCs) in Southern and Eastern Europe. In contrast, the North American market presents a more nuanced picture. While the US domestic market has shown weakness, with year-on-year declines in the latter half of 2025, the international segment continues to grow, resulting in an overall positive capacity change for the region. Globally, seat capacity growth is expected to reach 3.6% by the end of 2025, with similar trends anticipated for 2026.

    Chart 2: Global seat capacity trend

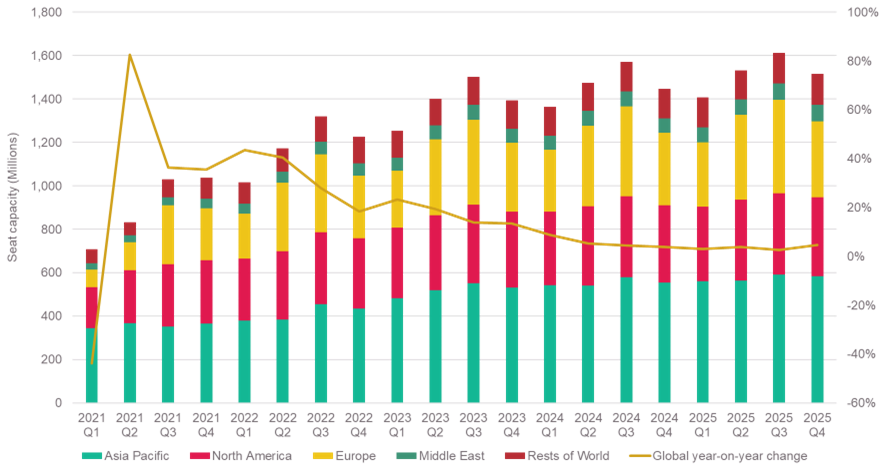
    Source: Cirium Core, Flight schedules dated 31 October 2025

    Despite the optimistic demand outlook, the industry continues to grapple with aircraft supply shortages. During the pandemic, it is estimated that over 3,600 aircraft deliveries from Airbus and Boeing were cancelled or deferred, creating a significant deficit. However, the situation has gradually improved, with both manufacturers ramping up production rates. Data from Cirium Fleets Analyzer indicates that the Airbus A320 family averaged 55 first flights per month in Q3 2025 and reaching 68 in September 2025. Boeing has also shown progress, averaging 38 737 first flights over the past three months following the resolution of 737-9 and FAA certification challenges in 2024. Cirium Ascend Consultancy estimates 1,390 single-aisle and twin-aisle aircraft to be delivered by the two major OEMs in 2025. The global passenger fleet now exceeds 22,000 aircraft, compared to 20,000 in 2019.

    Chart 3: The monthly first flight trend of single-aisle aircraft from Airbus and Boeing

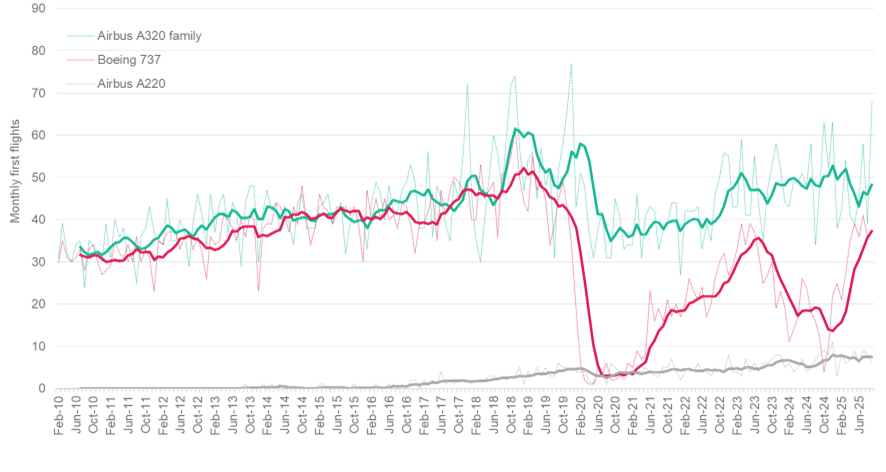
    Source: Cirium Core, Fleets Analyzer dated 13 October 2025

    While the aircraft deficit persists, it is now significantly lower than the initial shortfall. Cirium Ascend analysis estimates the single-aisle passenger aircraft shortage at fewer than 200 units, while the twin-aisle deficit remains around 700. The longevity of single-aisle aircraft has been extended, aided by relatively low and stable oil prices, which make continued operation of older models economically viable. Conversely, many older twin-aisle aircraft were retired or converted to freighters during the pandemic and are unlikely to return to passenger service. Repeated delays to the Boeing 777X program is expected to prolong the shortage of twin-aisle aircraft, potentially impacting long-haul capacity planning.

    In summary, the outlook for passenger demand in 2026 remains robust, supported by continued recovery in international travel, easing supply constraints, and sustained growth in emerging markets. Global airline seat capacity in 2026 is projected to increase by approximately 3-4% compared to 2025. However, growth rates will vary across regions, reflecting differing market dynamics and operational challenges. Airlines are expected to maintain disciplined capacity management, balancing expansion with the realities of ongoing aircraft supply shortages and operational complexities.


    Cirium is a proud sponsor of the 157th IATA Slot Conference. Don’t miss the opportunity to connect with the team to learn more about how we’re supporting the aviation industry with data and insights to power smarter decisions across operations.

    Whether you’re optimizing network planning, enhancing day-of-operations performance, or evaluating route economics, we enable you to unlock new efficiencies and opportunities.

    Secure your meeting with the team today – we look forward to seeing you in Lisbon!

  • A deep dive into the Middle East aviation market 

    Cirium recently hosted its inaugural Middle East Market Briefing, bringing together industry leaders and experts to analyze the region’s aviation landscape. The event provided a comprehensive overview of the market, covering everything from post-pandemic recovery and fleet growth to future forecasts and operational performance. 

    The briefing included presentations featuring global and Middle East insights, as well as a keynote interview with Firoz Tarapore, CEO of DAE Capital. It offered a detailed examination of current trends and future projections, highlighting the region’s robust growth and strategic importance in global aviation. This article recaps the key data and insights shared during the event. 

    Global economic context and market status

    Stephen Burnside, Global Head of Cirium Ascend Consultancy began the briefing by setting the global macroeconomic scene. The current economic climate is diverging from the “goldilocks” scenario once envisioned for 2025-2026, where conditions were expected to be “not too hot, and not too cold.” Instead, many economic figures are approaching multi-decade highs or lows, creating a more complex environment for the aviation industry to navigate. 

    Despite these global headwinds, the airline industry is showing resilience. The International Air Transport Association (IATA) forecasts continued growth in airline revenue and profit into 2025, signaling sustained recovery and operational strength across the sector. 

    Middle East: a story of resilient recovery 

    A central theme of the briefing was the remarkable recovery of air travel in the Middle East. Andrew Doyle, Senior Director Market Development, provided an analysis of Cirium Diio FM traffic data which reveals that passenger numbers at Middle Eastern airports have not only bounced back from the pandemic dip but have surpassed pre-pandemic levels, reaching a new record in 2024. 

    This trend is also reflected in flight schedules. Data from Cirium Diio SRS Analyzer shows a consistent and strong recovery in scheduled passenger flights. This upward trajectory demonstrates the resilience of the region’s carriers and the sustained demand for air travel to, from, and within the Middle East. The area continues to solidify its position as a critical global hub. 

    Fleet dynamics: growth and future outlook

    The in-service commercial fleet in the Middle East has experienced significant growth over the past three decades. Cirium Ascend Fleets Analyzer data illustrates a steady expansion across all market classes, from narrowbodies to widebodies. This growth trajectory is set to continue. 

    Aircraft orders and backlogs
    The demand for new aircraft remains strong. The global single-aisle backlog is rising again, now equivalent to nine years of production at forecasted delivery rates. Similarly, the twin-aisle backlog has increased substantially in 2025, representing eight years of production. This indicates a long-term commitment from airlines, including those in the Middle East, to modernize and expand their fleets. 

    Aircraft values and lease rates 
    The strong demand for aircraft has also influenced market values and lease rates. Over the past year, values for all aircraft classes have increased by 4-16%. Widebody aircraft saw the most significant gains in lease rates, with a 14% increase year-on-year as of October 2024. This reflects the high demand for long-haul travel and the strategic value of widebody fleets for the region’s network carriers. 

    20-Year Fleet Forecast: doubling down on growth

    Looking ahead, the Cirium 20-Year Fleet Forecast projects a bright future for the region. The global passenger fleet is expected to grow by 23,000 units over the next two decades, and the Middle East is a key driver of this expansion. 

    Middle Eastern carriers are forecast to grow at an impressive 4.9% annually. This growth will be propelled by the continued strength of Gulf network hubs and the rapidly expanding Saudi Arabian market. As a result, the region’s passenger aircraft fleet is projected to more than double by 2044, cementing its role as a powerhouse in global aviation. 

    Find out more about the 2025-2044 Cirium Fleet Forecast

    Operational excellence and performance

    The briefing also explored the operational side of the industry, highlighting the performance of Middle Eastern airlines and airports. 

    On-Time Performance 
    Many Middle Eastern carriers demonstrated exceptional reliability. The region’s airlines that achieved the highest rates of on-time departures during the first three quarters of 2025 were highlighted. Several carriers also showed significant improvement in their departure punctuality compared to the previous year, underscoring a commitment to operational efficiency and passenger satisfaction. 

    Ground events and maintenance 
    The region is also a key center for aircraft maintenance. An analysis of Cirium Ascend Ground Events showed that 14 heavy checks on Boeing 787 aircraft have been completed in the Middle East to date. This capability is vital for maintaining modern, complex fleets and ensuring aircraft are available to meet passenger demand. 

    Strengthening demand and fares 
    Data for Arab Air Carriers’ Organization (AACO) members shows that passenger demand has continued to strengthen throughout the year. This sustained demand underpins the positive financial and operational trends seen across the region. 

    A focus on sustainability 

    Sustainability was another important topic. A review of flight emissions revealed the Middle Eastern airlines and airports with the lowest emissions intensities for the period of January to September 2025. This highlighted the positive impact of operating modern, fuel-efficient fleets and showcased the region’s progress in addressing aviation’s environmental responsibilities. 

    Your partner in aviation analytics 

    The inaugural Middle East Market Briefing underscored the region’s dynamic and resilient aviation sector. With record passenger numbers, significant fleet expansion, and strong operational performance, the Middle East is poised for continued growth and leadership in the global industry. 

    Cirium’s data and analytics provide the foundation for understanding these complex market dynamics. If you would like to explore these insights further, our dedicated team in the Middle East is ready to assist.  

    Contact us to learn how Cirium can support your organization’s strategic goals. 

  • A journey through the ISTAT Professional Development Program

    Cirium Ascend Consultancy is trusted by clients across the aviation industry to provide accurate, timely, and insightful aircraft appraisals. The team provides the valuations and analysis the industry relies on to understand the market outlook, evaluate risks and identify opportunities.

    Discover the team’s industry reports & market commentaries. Read their latest expert analysis, viewpoints and updates on Thought Cloud.

    Eleni Maragkou, Valuations Analyst, Cirium Ascend Consultancy

    Completing the ISTAT Professional Development Program (PDP) was a valuable and rewarding experience, that strengthened both my technical and professional expertise within the aviation finance industry.

    The programme offered valuable deep dive into every aspect of the aviation industry, from aircraft valuation, design and manufacturing to finance and trading. Each module provided practical insight into the commercial and financial drivers that shape the aviation sector. Another significant advantage of the course was the opportunity to network with classmates and knowledgeable course leaders who come from diverse areas across the industry, which supported my understanding the value of the course and its benefits.

    A particular highlight was my opportunity to present my slides on the topic of “Why is aircraft valuation both an art and a science?”, which is a very immersive and open-ended topic. This experience enhanced and demonstrated my ability to communicate complex topics, and our group received positive feedback on both content and delivery.

    The visit to the Airbus A350 assembly line in Toulouse, was another highlight, offering valuable perspective and understanding on aircraft design, production, and programme implementation.

    Towards the final sessions of the course, we conducted an exciting assessment on whether we should place an aircraft on lease or sell it, and the reward for achieving this was a golden ticket which entitles the holder to sit out the final exam. After many discussions and questions, I was informed by the course leaders that I won the tickets, however, I still chose to sit the exam regardless with my fellow coursemates. Additionally, I was also recognised for among the high scores in class along with my graduation diploma.

    Overall, the ISTAT PDP deepened and enhanced my understanding of the aviation value chain, strengthened my commitment to continued professional growth in the industry and provided me with valuable industry connections.

  • Royal Jordanian Airlines: 95% OTP. A Middle East Success Story

    Mike Malik, Chief Industry Officer, Cirium

    Finding Space Between the Giants

    While Gulf carriers built empires on long-haul wide-body operations, Royal Jordanian identified a different opportunity in the early 2000s. The airline positioned itself as the region’s connectivity specialist, deploying efficient regional jets to secondary cities that larger carriers couldn’t economically serve with 777s and A380s. Routes across the Middle East, North Africa, and the Gulf that seemed too small for the big players collectively created a robust feeder system.

    This wasn’t just about filling gaps—it enabled frequency. More daily departures mean flexibility for business travelers, and flexibility converts to loyalty faster than price alone ever will.

    Global Reach Through Strategic Leverage

    The regional focus provided foundation, but Royal Jordanian’s 2007 entry into Oneworld transformed its competitive position. Suddenly, a carrier focused on short-haul connectivity could offer seamless global itineraries. A passenger could fly Royal Jordanian from a secondary Middle Eastern city through Amman, then connect onward via British Airways, American, or Cathay Pacific—all on one ticket with reciprocal benefits.

    The alliance delivered network scale without requiring capital-intensive fleet expansion. Royal Jordanian maintained operational control over what it does best while gaining access to hundreds of global destinations through partnership infrastructure.

    Differentiation Through Service Quality

    When Air Arabia, flydubai, and Jazeera Airways disrupted the market post-2008 with aggressive pricing, Royal Jordanian faced a choice: compete on price or compete on value. They chose value.

    The airline upgraded cabins, enhanced ground services at Queen Alia, and strengthened the Royal Club loyalty program while maximizing Oneworld benefits. The bet was straightforward—there’s a segment willing to pay more for reliability, comfort, and convenience, even in price-sensitive markets.

    That positioning creates breathing room. Low-cost carriers optimize for different economics and different passengers. Full-service carriers that try to match LCC pricing while maintaining legacy cost structures can lose twice—once on margin, once on brand clarity.

    The Operational Discipline Behind the Rankings

    Royal Jordanian operates over 500 weekly flights with more than 110 daily departures from Amman, spanning four continents. That operational intensity requires precision, and the 2025 performance data demonstrates sustained execution:

    Looking at these month-by-month results, what stands out isn’t just the peaks—it’s the consistency. Using Cirium’s definition of on-time arrivals within 15 minutes of schedule, Royal Jordanian maintained discipline even when they slipped to 5th in June. The airline had finished 3rd regionally in the 2024 Annual Review with 87.02% OTP and 99.31% completion rate.

    These aren’t isolated wins. They represent systematic process management across route planning, turnaround operations, and real-time decision-making under operational pressure.

    Leadership and Execution

    What changed under Chairman Said Darwazeh and CEO Samer Majali wasn’t the strategy—Royal Jordanian’s regional focus predates their tenure. What changed was execution discipline. Majali, who returned to Royal Jordanian in 2021 after leading Gulf Air and SaudiGulf Airlines, brought additional operational discipline that shows in the numbers.

    The 2024 results tell the story: operating profit jumped 260% to JD11.8 million on revenues of JD745.6 million, while carrying 3.7 million passengers. More telling—the airline is self-funding fleet modernization rather than relying on government capital injections. The leadership has plans to have had 70% of the fleet renewed by year-end.

    Fleet decisions drive operational performance. Based on the most current information from Cirium Fleets Analyzer, the airline operates 35 Aircraft currently with 11 on order. Order book includes a six B787-9’s, three A321’s, one A320 and one E195 E2. The average age of the current fleet is 8.7 years. This fleet mix is clearly about matching equipment to mission—and creating the frequency advantage that built the business model in the first place.

    Lessons for Mid-Sized Carriers

    H.E. ENG. SAMER ABDELSALAM MAJALI, Vice Chairman / Board Designee CEO, Royal Jordanian

    Royal Jordanian’s performance offers a template, particularly for mid-sized carriers navigating between legacy constraints and LCC disruption. The lessons are transferable:

    Strategic focus beats scale ambition. Trying to compete everywhere usually means winning nowhere. Royal Jordanian identified underserved regional routes and dominated them rather than fighting for share on contested long-haul corridors.

    Alliances multiply capability without multiplying cost. Oneworld membership gave Royal Jordanian global network reach without the capital requirements of building it organically. For carriers lacking the resources of Gulf super-connectors, alliance leverage becomes essential infrastructure.

    Service differentiation requires operational proof. Promising better service means nothing if flights don’t depart on time. Royal Jordanian’s OTP performance validates their service positioning—customers paying premium fares need reliability first.

    Strategic Clarity in a Crowded Market

    Royal Jordanian didn’t try to become Emirates or match Ryanair’s cost structure. They carved out defensible territory and executed with precision. What strikes me about their approach is the clarity—in an industry where many carriers struggle to articulate what makes them different, Royal Jordanian’s focus is unmistakable.

    That September result—95.39% with perfect completion—isn’t an outlier. It’s what happens when strategy and execution align consistently. With three months remaining in 2025, I’m watching closely to see if they can maintain this momentum through year-end.

  • Cirium forecasts 46,500 aircraft deliveries worth $3.4 trillion

    LONDON (Oct. 14, 2025) – Cirium, the world’s most trusted source of aviation analytics, today published its annual Fleet Forecast, revealing the future of the global commercial passenger and freighter aircraft market.

    The long-running independent forecast, produced by Cirium Ascend Consultancy, predicts 46,500 aircraft will be delivered globally over the next 20 years, equating to a total value of USD$3.4 trillion, as airlines continue to invest in newer, more sustainable aircraft.

    However, this year’s forecast comes as the aviation industry faces continued supply chain issues, geopolitical uncertainty, and delays to certification of new programmes, tempering the pace of fleet growth. The analysis projects a 6% reduction in deliveries over the next seven years compared to last year’s edition, mainly due to single-aisle aircraft production ramping up slower than expected. Long-term demand remains strong, with a 1% increase in deliveries overall.

    Other key findings include:

    • Asia continues to drive fleet growth, accounting for 45% of deliveries, led by demand in China and India.
    • Airbus and Boeing are projected to deliver 85% of aircraft and 92% by value through 2044, while COMAC is expected to capture 6% of global demand.
    • Single-aisle aircraft now account for 71% of the global fleet, while twin-aisle and regional jets remain below pre-pandemic levels.

    Stephen Burnside, Global Head of Cirium Ascend Consultancy, said: “This year’s Cirium Fleet Forecast shows the global aviation industry is moving forward with confidence despite near-term headwinds. Long-term demand remains robust across every region, airlines continue to invest in fleet renewal, and OEMs continue to incrementally increase their R&D budgets in preparation for the next generation of aircraft families. The next chapter of aviation growth is being defined by the need for supply chain resilience, production capacity right sizing, product and service innovation, and a focus on efficiency.

    An executive summary of the Cirium Fleet Forecast is available to download here.


    For Cirium media inquiries please contact media@cirium.com

    Notes to editors:

    • The forecast covers aircraft sized from 30 seats upwards and their freighter equivalents.
    • The forecast does not include electric, hybrid or hydrogen-powered aircraft programmes, as the development of existing or all-new commercial aircraft is expected to be centred on conventional propulsion, powered by increasing use of sustainable aviation fuel (SAF).

    About Cirium 
    Cirium® is the world’s most trusted source of aviation analytics. The company delivers powerful data and cutting-edge analytics to empower a wide spectrum of industry players. It equips airlines, airports, travel enterprises, aircraft manufacturers, and financial entities with the clarity and intelligence they need to optimize their operations, make informed decisions, and accelerate revenue growth. 

    Cirium® is part of LexisNexis® Risk Solutions, a RELX business, which provides information-based analytics and decision tools for professional and business customers.  The shares of RELX PLC are traded on the London, Amsterdam and New York Stock Exchanges using the following ticker symbols: London: REL; Amsterdam: REN; New York: RELX. 

    For more information, follow Cirium® on LinkedIn or visit cirium.com.

  • King Khalid International Airport: Precision, Planning and Performance in Riyadh

    Mike Malik, Chief Industry Officer, Cirium

    King Khalid International Airport (RUH), positioned 35 kilometers north of Riyadh, Saudi Arabia has established itself as a global benchmark for airport operational excellence. In Cirium’s 2024 On-Time Performance Awards, RUH was recognized as the Most On-Time Global Airport, achieving an industry-leading departure OTP rate of 86.65%—a distinction that places the airport at the forefront of global aviation performance standards.

    In 2024, the airport handled a record-breaking 37 million passengers with double-digit year-on-year growth, added 15 new airlines to its roster and recognized as the second busiest airport in the Kingdom. These results demonstrate effective integration of infrastructure, planning, and process optimization across increasing passenger volumes.

    Leadership Driving Transformation

    Under the stewardship of CEO Ayman Abdulaziz AboAbah, who was appointed in February 2024, Riyadh Airports Company has accelerated its operational excellence initiatives. Mr. AboAbah brings extensive aviation sector experience, having previously served as CEO of Jeddah Airports where he enhanced planning and operations at King Abdulaziz International Airport. His tenure has coincided with RUH’s ascent to global recognition, reflecting strategic focus on operational discipline and systematic performance improvement.

    The leadership team’s commitment to excellence has resulted in exceeding revenue targets by over 15%, with enhanced offerings, stronger partnerships, and significant increases in passenger movements, according to industry reports. This performance underscores the airport’s evolution from regional gateway to emerging global hub.

    Operational Resilience Through Strategic Infrastructure

    Ayman Abdulaziz AboAbah, CEO, Riyadh Airports Company

    RUH’s performance reflects purposeful modernization strategies implemented over several years. The expansion of Terminals 1 and 2 increased the airport’s passenger handling capacity by 40% — from 10 million to 14 million annually. By upgrading baggage handling, adding security lanes, and introducing automation like self-service kiosks and automated boarding gates, the airport has cut processing times per passenger and unlocked higher throughput.

    The 2022 commissioning of Terminals 3 and 4 marked a decisive step in RUH’s evolution. Terminal 3’s reconfiguration from domestic to international operations represents an important strategic shift to accommodate long-haul growth. A centralized check-in system now serves both terminals, allowing flexible resource utilization and enhanced operational fluidity. These terminal linkages, combined with renewed airside control infrastructure, have streamlined aircraft movements and reduced turnaround times—key enablers of on-time departures.

    The airport’s connectivity received another boost with the opening of Riyadh Metro Line 4 on December 1, 2024, providing passengers with efficient access to the city center through stations serving all terminal complexes.

    Strategic Alignment with National Objectives

    RUH’s growth is tightly linked to Saudi Arabia’s Vision 2030, supporting Riyadh’s emergence as a global hub for business and tourism. Backed by GACA and managed by Riyadh Airports Company, its development roadmap ensures infrastructure expansion matches the pace of rising traffic and future demand—positioning RUH as a cornerstone of national connectivity.

    The on-time performance gains reflect systematic operational improvements rather than statistical outliers. Enhancements to landside and airside coordination, expansion of aircraft parking bays, and deployment of real-time operational control technologies are part of a disciplined approach to minimize delays and improve predictability across the passenger journey.

    Data Standards and Industry Recognition

    Cirium’s On-Time Performance program serves as the gold standard for measuring airline and airport operational performance, using rigorous methodology that combines global flight tracking with airport-level operational data. On-time flights at airports are defined as those departing within 15 minutes of scheduled departure times. RUH’s recognition within this program reflects not only punctuality but consistency—demonstrating reliable performance across a complex operational environment.

    The achievement underscores a broader transformation taking place across the Kingdom’s aviation sector—one that extends well beyond operational metrics to fundamental shifts in how airports can function as economic catalysts.

    From Regional Gateway to Global Hub

    Since opening in 1983, King Khalid International Airport (RUH) has evolved from a regional gateway to a critical global node. The transformation required infrastructure investment, operational discipline, and leadership vision working in concert.

    Today, King Khalid International Airport (RUH) stands as one of the world’s most efficient large airports—a working model for how airports can excel amid rising expectations and traffic complexity. In an industry where timing defines competitive advantage, RUH’s four decades of strategic evolution positions it as an essential component of Saudi Arabia’s aviation future, proving that systematic operational excellence achieves results that resonate across global performance benchmarks.

  • For the aircraft engine market, newer may not be better – yet

    Vanessa Gu, Asia Finance Editor, Cirium

    Power to perform: The aircraft engine market was broadcast live Thursday 25th September.

    The cost of maintaining new-generation engines is expected to be higher than current-generation engines even with improvements in hardware, supply and the easing of MRO constraints.

    That is as the latest engines are requiring more shop visits than those of 10 years ago as more efficient fuel burn has inadvertently resulted in quicker wear and tear, and shorter time on wing.

    While ongoing improvements such as Pratt & Whitney’s GTF Advantage programme and more durable blades on the CFM International Leap engines are expected to allay some of those issues, “it still is an altogether different level of cost on engines now compared with the previous generation,” says Giles Thomas, Managing Director at Charlotte Parker Associates.

    “So it will get better. I don’t think, unfortunately, we’re going to get back to the levels of time on wing and product robustness, or reliability … that we, for example, saw relatively now on the CFM56, V2500, widebody, GE CF6, Trent 700 which were pretty predictable,” he adds, while speaking on a panel Cirium’s ‘Power to perform: the aircraft engine market’ webinar.

    At the same time, the unreliability of new-generation engines has made an increasing number of airlines “a bit reluctant to look into the new technology aircraft also because there’s a lot of risk which they got to take on that,” says Mahesh Kumar, chief executive of Capital A subsidiary Asia Digital Engineering, who was also on the panel.

    That reluctance has been exacerbated by engine manufacturers moving away from power-by-the-hour agreements as OEMs have underestimated the amount of maintenance and repair their engines need, says Kumar.

    Coupled with the ongoing supply chain crunch and MRO slot constraints, the values and lease rates of old and new generation engines have rocketed in the past six years, leaving airlines to bear the brunt of added costs.

    “That’s the interesting part of it – your product [new generation engines] is not reliable, the value of your engine went up because the demands spiked up, so on that I would say the airlines are on the suffering part of it,” Kumar states.

    Engine values and lease rates

    The market lease rates of narrowbody and widebody engines have gone up by 34% and 23%, respectively, while market values are up 14% and 5%, respectively, compared to September 2019, details Cirium’s Senior Valuations Analyst Lionel Olonga on the webinar.

    Breaking it down further for narrowbody engines, the increase in value is most pronounced over the last two years for CFM56-7B engines that power Boeing 737-800s and International Aero Engines V2500 powering Airbus A320ceos.

    The increase in values for -7Bs are mainly driven by the NGs operating for longer due to delivery delays, while the increase for V2500s are due to operators which have A320neos powered by Pratt & Whitney’s PW1100G engines in their fleet renewal plans increasing the use of their existing -ceos, explains Olonga.

    On market lease rates, PW1100G has seen a more than two-fold increase on lease rates compared with 2019, while the Leap-1A and -1B engines have seen a more than 50% increase.

    These increases come on the back of an uptick in maintenance costs and green time value for new generation narrowbody engines – such as the Leap and GTF – which have increased by over 50% in the last six years, while those for CFM56s and V2500s are 10-30% higher, says Olonga.

    Widebody engines also tell a similar story, with maintenance costs and green time values up 60% for new generation engines and a 10-30% uptick for older generation engines.

    Gradual decline to sane pricing

    The current issues facing the industry have been described as a perfect storm that is expected to bare its teeth until the end of the decade.

    However, as the supply of new aircraft increases and as MRO constraints ease, there will be a “readjustment”, says Thomas, though he cautions it will be gradual and measured.

    As older aircraft retire with the incoming new generation jets, Thomas is of the view that values of CFM56s or the V2500s “will certainly decline”.

    “A decline, I should clarify, doesn’t mean … necessarily, very quickly. And what I mean is decline from the current very high levels today” to “historic levels pre-Covid” before the aircraft types start retiring in volume, he says.

    An example of “high levels”, he details, is how he heard anecdotally that “completely run out” CFM56 engines with no performance left and “virtually done” life limited parts trading for above $3 million.

    “Therefore, that sort of elevated level of value, which is purely a factor of lack of MRO capacity and lack of power supply, that will disappear, so therefore the engine values would, for that sort of engines, go back to a million or less,” he goes on to say.

    In the meantime, however, values for engines are expected to stay high as airlines continue to grapple with a litany of issues ranging from MRO slot constraints and unreliability of new generation engines.

    Kumar says the need for spares is not merely about manufacturers producing the required engines but also related to increased shop visits due to engine reliability issues.

    And shop visits now have longer turnaround times and increased costs, and from an airline’s perspective, “it might make sense to get another engine in, rather than putting the older engine for a shop visit,” states Kumar. This in turn further drives up values.

    Regardless of when the gradual fall of values might happen, Thomas cautions: “If one is investing in engines today, one needs to be very aware of what engine build standard one is investing in, so that you have some knowledge and competence in the longevity of that particular engine variant of any new engine technology engine.”

    Premature aircraft partout will continue (for now)

    There are at least 15 A320neo family aircraft that have been retired for part-out as the value of a pair of engines is hovering close to 70% of total aircraft value for the type, says Olonga.

    With the value of engines taking up such a big portion of aircraft value, the interest in purchasing aircraft for the engine or for parting them out is expected to continue.

    Thomas recalls how one airline said it was doing four engine changes in the next 10 days “purely to keep its fleet flying”, highlighting a “horrendously complex situation which is not going to be cured quickly”, meaning demand for part-out engines will remain high.

    At the same time, for lessors, leasing an aircraft at a price they need while taking into consideration the high engine values may be hard for airlines to swallow.

    “Therefore the solution for engines is actually pretty neat, and the byproduct of that also is all the serviceable used material from the rest of the aircraft and airframe,” says Thomas.

    Kumar likewise concurs that interest in parting out new generation aircraft will continue, recounting that an airline was willing to lease a widebody just to drop both the engines and put it back to operations.

    “It makes complete sense for the lessors to just drop the engines from the aircraft and then lease it where they can make a better margin out of it, rather than leasing the whole plane,” he says, adding that it also reduces transition and redelivery costs.

    Despite the continued interest, it is widely acknowledged that the parting out of six-year-old aircraft with years of service left due to part shortages and limited MRO slots is highly unsustainable.

    While Thomas expects the situation to continue in the shorter to medium term, he hopes to see “common sense and normal rules of the aviation industry returning in a couple of years’ time”.

    Power to perform: The aircraft engine market is now available to watch on demand.

  • Greenwashing in Aviation: The Need for Accurate Emissions Data

    In recent years, the aviation industry has come under increasing scrutiny for its environmental claims, driven by regulatory oversight and growing demands from consumers and investors for genuine sustainability efforts. Greenwashing—misleading or exaggerating such claims—poses significant reputational, financial, and legal risks for the aviation industry. Addressing this issue requires a shift toward transparency and the adoption of accurate, data-driven approaches to emissions measurement. The following Q&A explores the risks of greenwashing, the limitations of traditional emissions reporting, and how advanced analytics can help the sector move forward with credibility and confidence. 

    Q: What is “greenwashing” in the aviation industry? 
    A: Greenwashing refers to the practice where airlines make invalid or misleading claims about their environmental efforts. This can involve exaggerating the impact of sustainability initiatives, leading consumers and stakeholders to believe the company is more environmentally friendly than it actually is. 

    Q: Why is greenwashing a significant issue for airlines? 
    A: Greenwashing poses several risks. It erodes public trust and investor confidence, which can damage a brand’s reputation. It also attracts regulatory scrutiny, as seen with the European Commission’s 2024 action against 20 airlines, potentially leading to significant financial and legal consequences. 

    Q: How does greenwashing affect an airline’s relationship with investors? 
    A: Investors are increasingly using Environmental, Social, and Governance (ESG) criteria to guide their decisions. Greenwashing creates uncertainty and undermines a company’s credibility, which can deter environmentally conscious investors and limit an airline’s access to capital. 

    Q: Why are traditional methods of calculating carbon emissions becoming insufficient? 
    A: Many traditional carbon calculators rely on broad estimates and assumptions that do not account for critical variables like aircraft type, engine efficiency, or actual fuel burn. This can lead to imprecise and inconsistent data, making it difficult to report progress accurately or comply with evolving regulations. 

    Q: What is the solution to inaccurate emissions reporting? 
    A: The industry needs to adopt an independent monitoring system that provides reliable, verifiable, and scientifically accurate emissions data. This approach enhances transparency, supports regulatory compliance, and builds trust among customers, investors, and regulatory bodies. 

    Q: How can advanced analytics improve emissions measurement? 
    A: Advanced analytics platforms, such as Cirium’s EmeraldSky, use cutting-edge techniques and a wide range of proprietary data to calculate CO2 emissions with unparalleled precision. By analyzing specific flight and aircraft details, these tools move beyond general estimates to provide an accurate measure of fuel burn and emissions for both flown and forecasted flights. 

    Q: What is EmeraldSky? 
    A: EmeraldSky is an advanced methodology developed by Cirium that integrates extensive data and analytics to achieve a highly precise measurement of aircraft CO2 emissions. It provides the industry with the accuracy and transparency required to meet environmental commitments and support credible sustainability reporting. 

    Q: What actionable steps can airlines take to combat greenwashing? 
    A: Airlines should commit to transparency by using independent, verified data for emissions reporting. Investing in advanced analytics will allow for precise measurement and optimization. It is also important to communicate sustainability strategies clearly, using verifiable data to back all claims and foster collaboration across the industry to establish a universal standard for emissions measurement. 

    In summary, addressing greenwashing in aviation is not only a regulatory challenge but an opportunity to strengthen trust, safeguard reputation, and build a resilient pathway to net-zero. Through transparent practices and the application of accurate, science-based emissions data, the industry can demonstrate true progress, meet stakeholder expectations, and support broader sustainability objectives. 

  • Golden Week: Domestic Dominance, International Growth Trends

    Harry Chan, Head of Greater China, Cirium

    • Japan, South Korea, Hong Kong SAR, Thailand and Singapore account for 50% of China’s total international seat capacity.
    • Japan maintains its position as the most popular destination, with South Korea following closely behind.
    • Southeast Asia presents mixed results, with Vietnam, Malaysia and Singapore growing in popularity, while Thailand declines.
    • Shanghai Pudong Airport (PVG) continues to dominate as China’s primary international hub.

    As China’s National Day Golden Week approaches, the aviation industry is closely examining seat capacity trends to prepare for this peak travel period. Taking a look at Cirium’s data between 29th September and 10th October across the years, we are able to identify shifts in both domestic and international travel trends, destination preferences and key aviation hubs.  

    A detailed examination of seat capacity, particularly on international routes, offers comprehensive insight on how airline operations can strategically plan to meet the expected surge in demand during this holiday period.

    Domestic travel remains strong while international growth surges

    Source: Cirium SRS Analyzer, scheduled seat capacity between 29 September to 10 October 2025.

    In recent years, the National Day Golden Week holiday season has seen a consistent upward trend in overall seat capacity, propelled by the surge in domestic flight capacity. Since 2024, domestic flights have accounted for over 90% of the total capacity, marking a significant increase from the 87.7% in 2019. This reflects the growing preference for travel within Mainland China.


    While domestic flights continue to take up the majority of market volume, international capacity is expanding at a rapid pace. Between 2024 and 2025, international seat capacity is projected to grow around 10%, outpacing the modest 4% growth seen in domestic capacity.  This points to a renewed and growing appetite among Chinese travelers for overseas destinations, even as domestic travel remains dominant.

    Source: Cirium SRS Analyzer, scheduled seat capacity between 29 September to 10 October 2025.

    Interestingly, the top five countries/regions (Japan, South Korea, Hong Kong SAR, Thailand and Singapore) accounts for 50% of China’s total international seat capacity.

    A detailed look at the top 10 international destinations shows a dynamic shift in traveler preferences. Japan leads as the most popular destination for Golden Week 2025, recording a 17.6% year-on-year increase in seat capacity. South Korea retains a strong second place, reinforcing East Asia’s continued appeal.

    Southeast Asia has experienced the most notable change, showing an overall decline of approximately 8% compared to 2019. Thailand, once the top destination in 2019, has dropped to the fourth position, with seat capacity now nearly halved since its peak in 2019. In contrast, Vietnam has seen outstanding growth of more than 53% since 2024, highlighting its rising popularity. Singapore and Malaysia continue to gain momentum, posting gains of 7.3% and 12.6%, respectively.

    One noteworthy shift in the top 10 list is the absence of the United States, which was ranked sixth in 2019. Current geopolitical developments and travel constraints may have shifted demand towards destinations closer to China.

    Key airports supporting Golden Week travel

    Source: Cirium SRS Analyzer, scheduled seat capacity between 29 September to 10 October 2025.

    Source: Cirium SRS Analyzer, scheduled seat capacity between 29 September to 10 October 2025.

    Shanghai Pudong Airport (PVG) continues to assert its dominance as a pivotal international hub in the country, with a 10.4% increase in seat capacity from 2024. Following closely behind is Beijing Capital Airport (PEK)and Guangzhou Baiyun Airport (CAN), reinforcing these hubs as crucial gateways for both domestic and international travelers.

    Other than the obvious lead destination above, emerging destinations like Hanoi and Ho Chi Minh City have experienced significant growth in seat capacities over the past two years, increasing from rank 35 and 25 back in 2019, but now ranking at 11 and 13 respectively.

    Source: Cirium SRS Analyzer, scheduled seat capacity between 29 September to 10 October 2025.

    Seven of the ten busiest outbound international routes originated from PVG. China’s top international route is Shanghai Pudong to Osaka Kansai (PVG-KIX), which surged 35%, propelling it from fourth position in 2019 to first position in 2025. Similarly, Shanghai Pudong – Tokyo Narita (PVG-NRT) has also increased 14% compared to pre-covid days, noting an increasing attraction towards Japan.

  • GTF-equipped A320neos dominate lessors’ in-storage fleet in 2025

    Andrew Doyle
    Andrew Doyle

    Andrew Doyle, Senior Director, Market Development, Cirium

    By mid-July over half of operating lessor mainline passenger jet aircraft in storage were Airbus A320neos powered by Pratt & Whitney PW1100G geared turbofan (GTF) engines, Cirium Fleets Analyzer data shows. However, the vast majority of these were placed with operators, leaving only 38 – most of which were formerly operated by the now defunct Go First of India – designated as off-lease.

    Fleets Analyzer reveals nine lessors have 33 stored GTF-equipped neos that were with Go First, while two had been operated by VietJet Air and three by IndiGo. Cirium Ascend Consultancy estimates there are only around 140 additional off-lease single-aisles of all types in storage, plus around 20 widebodies.

    Meanwhile, the overall stored GTF A320neo fleet has stabilised at approaching 500 aircraft – principally due to the shortage of engines caused by well-documented powdered metal contamination issues – while the inactive inventory of all other models declined from a 12-month peak of almost 800 in January 2024 to around 480 by July 2025.

    Excluding GTF A320neos, the average age of stored operating lessor aircraft has increased from 12 years in July 2022 to 15.4 years for the same month in 2025.

    Source: Cirium Fleets Analyzer

    A net total of approximately 150 operationally leased 737-800s and A319/A320ceos entered storage between August 2023 and January 2024. However, these types have since seen a resurgence in demand thanks to the ongoing GTF issues and the supply chain difficulties preventing new aircraft production rates reaching planned levels.

    Operating lessors in July accounted for almost 1,500 delivered GTF-powered A320neo family single-aisles, of which just over a third are inactive. Of the top 30 lessors for this type (with portfolios of 10 aircraft or more) AerCap and SMBC Aviation Capital’s airline clients have seen the biggest impacts in terms of absolute numbers, although some smaller lessors have a greater portion of their smaller portfolios on the ground.

    Overall, fewer than half of the approaching 2,300 Airbus and Boeing passenger aircraft listed by Cirium as stored in July 2025 were operating lessor-managed. However, collectively they managed more than 83% of the just over 600 stored GTF A320neos.

    Meet the Cirium team at ISTAT EMEA 2025.

    Hear from Stephen Burnside, incoming Global Head of Cirium Asend Consultancy, Tuesday 7th October 2025 at 14:00.

  • How will airlines maximise value from the A321XLR?

    Cirium Ascend Consultancy is trusted by clients across the aviation industry to provide accurate, timely, and insightful aircraft appraisals. The team provides the valuations and analysis the industry relies on to understand the market outlook, evaluate risks and identify opportunities.

    Discover the team’s industry reports & market commentaries. Read their latest expert analysis, viewpoints and updates on Thought Cloud.

    Richard Evans airline consultant
    Richard Evans airline consultant

    Richard Evans, Senior Valuations Consultant, Cirium Ascend Consultancy

    With the first examples of the Airbus A321XLR variant now in service, the network plans for this sub-type of the extremely successful A321neo are starting to become clearer.

    There are now four airlines with aircraft in regular service, with at least two more to come by the end of 2025. It has not all been plain sailing for the new variant, however, with delays due to certification and seat supply issues. There has also been the news that Wizz Air is exiting the Abu Dhabi market, which calls into question its commitment to the XLR.

    Airbus does not formally split out variants within its A321neo order book. Cirium’s Fleets Analyzer currently shows a total of 15 aircraft delivered (11 in service and 4 currently stored), plus a firm order backlog of 461 units for commercial customers. This represents around 9% of the total A321neo backlog, but there could be additional commitments that have not been made public.

    To what extent the XLR is a niche version of the type, or not, is a relevant question for financiers and lessors, especially given the XLR commands a price premium for its capability. To illustrate this, Cirium’s Values Analyzer shows a Full-Life Market Value (FLMV) of $62.4m for a brand-new baseline A321neo (no ACTs, 93.5t Max Take-off Weight). This increases to $66.8m for an A321neo, with 3 tanks fitted and 97t MTOW. Although not an official nomenclature, this configuration is often referred to as an A321neo LR. For the XLR, FLMV increases to $71.9 million. For comparison, the smallest twin-aisle type currently in production, the 787-8, commands a FLMV of $127.9 million.

    A321XLR order book, as at 17 September 2025

    Operator regionOperatorDeliveredOn orderInitial deliverySeating layout (where known)
    Asia PacificAirAsia Group702027 
     Cebu Pacific92026236
     Drukair22030 
     IndiGo292025195
     Jetstar362027 
     Peach32030218
     Qanot Sharq32027 
     Qantas2172025200
     VietJet Air152026 
    EuropeAer Lingus422024184
     Azores Airlines12027 
     Iberia442024182
     Icelandair122027187
     Wizz Air Group3442025239
    Latin AmericaJetSmart Chile142030 
     LATAM Group52027 
     Sky Airline102026 
    Middle EastAir Arabia202028 
     Flynas102026 
     MEA42027160
     Saudia15  
    North AmericaAir Canada302026182
     Air Transat32027199
     American Airlines2482025155
     JetBlue (Aegean)132025138
     United Airlines502026150
    LessorsAerCap9  
     Air Lease Corporation18  
     Aviation Capital Group5  
     BOC Aviation10  

    Source: Cirium Fleets Analyzer

    The status of JetBlue’s order is unclear, with its first two aircraft destined for sale to Altavair on delivery, for onward lease to Aegean Airways. It also appears likely that the Wizz Air Group will convert some of its backlog to other versions of the A321neo.

    By the end of 2026, there are set to be at least 13 airlines flying the XLR, operating in a wide variety of seating layouts. Many, such as Aer Lingus, Air Canada, Aegean, American and United, will fly with lie-flat business class seats, in contrast to Wizz Air and other Low Cost Carriers (LCCs) flying with high-density seating layouts of 230-240 seats. Qantas plans two different layouts, with initial deliveries having a 37 inch pitch business product, but then others with full lie-flat business class for longer routes.

    The selling point of the XLR is additional range. Airbus markets the type as having a range of up to 4,700 nautical miles (nm), but this is subject to caveats. Firstly, this is the range with a standard dual-class seating configuration. Fitting more seats will mean less range. Secondly, real-world routings and headwinds generally cut the true capability, for great circle distances, by around 15%. Thus, the longest route that could be reliably flown year-round may be more like 4,000 nautical miles great circle. This is similar to London to Denver, or Sydney to Bangkok.

    For airlines configuring just 138-155 seats, the range capability may, conversely, be more than 4,000 nautical miles. These type of configurations, including business class and premium economy seats, are clearly aimed at high-yield premium markets.

    Airbus has not yet published a payload-range chart on its Airport Operations and Aircraft Characteristics website, but the below chart including the A321neo LR (97,000kg MTOW with 3 ACTs) highlights the issue of payload capability. It shows that for an LCC, such as Wizz Air with 239 seats, the aircraft is operating very close to its maximum payload of around 23 tonnes.

    A321neo payload-range capability

    Source: Airbus

    We believe the XLR will have a marginally higher empty weight than the LR, but that Airbus is looking to increase the MTOW from 101t to 101.5t to restore payload and/or range capability. It is thus likely that the XLR will have a similar maximum payload to the A321LR. This means that fitting 230 seats or more results in hitting maximum payload on routes with high luggage needs – typical of many routes to/from the Middle East, Africa, and Latin America. This is not an issue for network airlines, where they are fitting low-density dual-class or three-class layouts.

    The big question, therefore, is where do the XLR operators plan to fly their aircraft, and how far can they extend operations into markets previously only available to longer-range twin-aisle types?

    The longest routes currently flown by the initial operators are shown on the map below. Iberia’s Madrid-San Juan route is 3,448 nm great circle distance and Aer Lingus’s Dublin-Nashville flight is 3,394 nm. Wizz Air’s Gatwick-Jeddah and Milan-Abu Dhabi services are both around 2,550 nm. This highlights that the XLR is not really required for most Middle East to Europe operations, but also that the initial operators are not pushing the range out to anywhere near Airbus’s marketing figure. As an example, Etihad Airways recently stated it saw the A321LR as sufficient for its needs.

    Longest current A321XLR routes, November 2025

    Source: Cirium schedules data

    For reference, the longest A321LR route today is Sharjah to Kuala Lumpur by Air Arabia, with 215 seats, at 2,990 nm. This matches very well with the A321LR range in Airbus’s payload-range diagram of  around 3,500 nm, before track and headwinds are accounted for, at 21t of payload.

    Several other airlines have announced their initial A321XLR routes. Aegean has said it will fly to Mumbai (2,783 nm) and Delhi (2,697 nm) initially, potentially followed by Bangalore (3,216 nm). It will have a code-share partnership with IndiGo, who will also use its first XLRs on these two markets. Lastly, Air Canada will operate the type on Montreal to Edinburgh (3,031 nm), Toulouse (3,569 nm) and Palma de Mallorca. The latter is the longest route announced yet, at 3,777 nm, and will be a summer-only service.

    Analysis of existing and planned XLR routes indicates the real-world range network capability of the XLR (taking into account headwinds and track deviation) comes out more like 3,500-4,000 nm with low-density seat layouts, or considerably less for a 239-seat Wizz configured aircraft.

    To conclude, the A321XLR looks set to be a very important aircraft for many airlines, especially those seeking to maximise premium revenues on thinner business or leisure-focussed routes.

    For LCCs, it may be less attractive. For them, ancillary revenue is very important and flying longer missions does not necessarily maximise this. There may be more hold-bag fees and more opportunity to sell meals on longer flights, but there are fewer flights per day to do so. Having a sub-fleet of XLRs may also limit the ability to maximise asset utilisation across both short and long sectors.

    It is still too early to accurately forecast what proportion of the A321neo fleet the XLR will represent long-term. It may well be a relatively niche product, but has already been ordered by several influential major carriers. Liquidity could be an issue, but major network airlines tend to retain their aircraft longer, so this could be mitigated, such that the premium pricing for the type is justified.

  • Daily Emissions Peak Masks Aviation’s Big Efficiency Jump

    July 18, 2025, saw passenger jet operations generate 2.52 million tonnes of CO₂—0.1% above the previous daily record set in August 2019, according to EmeraldSky analysis from Cirium. The milestone caps aviation’s complete recovery from the pandemic collapse, but the path back reveals fundamental shifts in how the industry operates.

    Behind the seemingly modest 0.1% increase in total daily emissions lies a more complex story: airlines achieved a 7.4% improvement in fuel efficiency per available seat kilometer (ASK) while accommodating substantially more passengers. The mathematics of this recovery challenge long-held assumptions about the relationship between aviation growth and environmental impact.

    The Recovery Paradox

    Here’s what makes July 18 significant: airlines delivered 8.2% more ASKs than August 2, 2019 while increasing total emissions by just 0.1%. Flights crept up only 3.7% over six years, yet carriers found ways to accommodate surging demand through a wholesale reimagining of capacity deployment.

    The numbers tell the story. Average aircraft size grew by eight seats to 175 passengers per flight. Route distances stretched 3% longer to 1,626 kilometers on average. Flight times? They barely budged—up just 1.3% to 138 minutes despite busier airspace and longer routes.

    Efficiency Context

    The 7.4% efficiency improvement represents approximately 187,000 tonnes of CO₂ saved daily compared to 2019 operational standards, though absolute emissions still increased 0.1% due to capacity growth exceeding efficiency gains.

    When Plans Meet Reality

    The efficiency gains become more intriguing when viewed against operational headwinds. Flight-weighted average aircraft age jumped 17% to 11.6 years—exactly the opposite of what efficiency playbooks recommend. Post-COVID supply chain snarls and unexpected engine durability issues with newer aircraft meant airlines couldn’t simply buy their way to better performance.

    Instead, they had to extract more from what they had. The result: proof that operational innovation can deliver efficiency gains even when fleet modernization slows. It’s a finding that challenges conventional wisdom about the primacy of new technology in driving environmental progress.

    Fleet Reality

    Supply chain constraints and engine reliability issues resulted in older aircraft handling more operations than planned, yet airlines still achieved significant efficiency improvements through operational optimization.

    Beyond the Flight Plan

    EmeraldSky’s analysis goes deeper than standard industry calculations, which often miss 15-25% of actual emissions by relying on theoretical flight plans rather than operational reality. The system tracks 47 variables across more than 100,000 daily flights—everything from actual taxi times and routing changes to weight variations and holding patterns.

    This granular approach reveals efficiency improvements in unexpected places. Airlines didn’t just optimize cruise flight—they squeezed time from ground operations, streamlined routing coordination, and fine-tuned their networks. The 7.4% improvement represents the cumulative effect of hundreds of operational refinements, many invisible to passengers but clearly visible in the fuel burn data.

    Data Methodology

    EmeraldSky’s comprehensive tracking reveals operational efficiency improvements across multiple dimensions, including areas like ground operations and routing optimization that standard industry fuel burn calculations typically exclude.

    What 18 July, 25 Already Tells Us

    EmeraldSky’s real-time tracking confirmed what the industry suspected: July 18 was just the beginning. Emissions on 18 July 25 exceeded the 2019 record, and seasonal patterns suggest new peaks will become routine during Northern Hemisphere summer travel seasons.

    The question now isn’t whether aviation will set more emissions records—it’s whether the efficiency improvement trajectory can accelerate enough to bend the curve. With easier operational gains likely exhausted and sustainable aviation fuel still comprising less than 1% of consumption, the industry faces the mathematical reality that continued growth will require more fundamental changes to maintain environmental progress.

    Industry Analysis

    The 7.4% efficiency improvement over six years represents an annual rate of 1.2%, exceeding historical industry improvement trends but occurring alongside net emissions growth of 0.1% due to capacity expansion.

  • Air travel demand: Is it faltering?

    Thomas Sweeney - Cirium Ascend Consultancy
    Thomas Sweeney - Cirium Ascend Consultancy

    Thomas Sweeney, Valuations Associate, Cirium Ascend Consultancy

    As the summer winds down and we look ahead to a busy couple of months of conferences and events, I wanted to examine how risks to travel demand – which seemed unknowable six months ago – have been shaping up. In April when President Trump announced sweeping tariffs, the ensuing economic uncertainty was as large a risk to the aviation sector as the direct impacts of tariffs on aircraft trading. The latter continue to be defined and negotiated but the former have gained some clarity. The US market is naturally the most directly affected by recent events, though instability and contraction in the US economy will always have global ramifications. As the issuer of the world’s reserve currency and a major source of sovereign debt held globally, US economic instability quickly impacts global markets through shifts in dollar value, Treasury yields, and the productivity trends that underpin global growth expectations.

    Economists have been asking if the US is in a recession. Shortly after the tariffs were announced many were predicting one, albeit mild. Government data suggests that the economy is growing, and recession has been avoided so far [1]. However, a common view among economists is that growth in the country is highly unevenly distributed between both sectors of the economy, socioeconomic groups and geographical regions[2]. Large investments into AI have resulted in strong growth for companies developing and utilising the technology. A second major driver of growth has been by the wealthiest segment of Americans. The top 10% of earners account for nearly 50% of consumption[3]. Has the demand for air travel been buoyed by wealthy spenders and AI investment or is there weakness indicative of a weaker economy outside these areas?

    Growth in US capacity (ASKs) is correlated to overall GDP growth, amongst other factors. The correlation is not direct – there are specificities in the airline market distinct from the general economy – but the link is clear:

    Source: Cirium Core and Federal Reserve Economic Data (FRED)

    Zooming in to the most recent months, domestic capacity has been growing slower in 2025 than 2024 and, in some months, capacity has contracted.

    Source: Cirium Core

    Several US airlines cut capacity from Q2 onwards in response to the economic uncertainty caused by tariffs. Planned domestic and international capacity has been cut by up to three percent by US airlines.

    Source: Cirium Core

    Capacity growth is recovering in the later part of the year, potentially as the uncertainty has waned in recent months. Nonetheless, apart from 2020 heavily influenced by the Covid-19 pandemic, 2025 appears to be the weakest year for capacity growth in a decade.

    The picture is consistent with a growing economy for which there remains significant risk. Travel demand (and resulting capacity) within the US is exposed to the high-growth sectors of the economy, especially wealthy consumers who travel more frequently and in higher yielding cabins. Cutting capacity growth and focusing on premium travel can be a positive for airlines, allowing them to keep yields high. In the second half of 2025, capacity growth has been much slower in economy class seats, with business class seats remaining more robust.

    Source: Cirium Core

    Average US personal consumption expenditures have grown at their slowest level since 2020[4], which has been translating into the softening demand and capacity growth, even if it’s in lower-yielding cabins and sectors. Travel demand, like the US economy more generally, is likely to be highly sensitive to the consumption of the wealthiest segment of Americans. Any downturn which affects the spending habits of this group, such as a slump in AI confidence and investment, could impact air travel demand quickly. With risk concentrated in this way, close attention must be paid to economic signals for this group.

    The US domestic market is markedly weaker than other regions. Despite the impact of tariffs on other countries, most do not show significantly weakened economies as compared to the beginning of the year. Global scheduled ASK growth is healthy, sitting between 4% and 6% for most of this year.

    Source: Cirium Core

    Global demand is remaining strong. However, the nature of the global economy and financial system is such that issues in the US have an outsized influence globally. US growth is currently resting on a few small groups. Softening there could have downstream effects on not just the US domestic airline market but passenger demand globally. Therefore, it is critical that we continue to monitor the health of this market for warning signs and proactively consider how we will navigate those challenges.

    Meet the Cirium team at Airline Economics Growth Frontiers London 2025.

    Hear from Thomas on the SAF Panel, Thursday 18th September 2025 at 14:00. Eleni Maragkou will join the Lease Rates & Valuations Panel, Wednesday 17th September 2025 at 11:40.

    [1] fred.stlouisfed.org/series/GDPC1
    [2] www.ft.com/content/e9be3e3f-2efe-42f7-b2d2-8ab3efea27a8
    [3] https://www.wsj.com/economy/consumers/us-economy-strength-rich-spending-2c34a571
    [4] fred.stlouisfed.org/series/PCECC96

  • Passenger Liability: Read the Signs in Traffic & Schedules Data

    Kevin O’Toole, Chief Strategy Officer, Cirium

    How many passengers does an airline expect to carry over the next year, and of what nationalities?

    The question is deceptively simple, and seemingly crucial for anyone carrying exposure to passenger liabilities. As any underwriter knows, the answer has been far from straightforward. But there is now data out there, which, with the addition of a data science model or two, is helping to paint the pattern of future flying. It is, after all, what airlines themselves use to build network plans through tools such as Cirium’s Diio suite.

    Take the first part of the problem, around the change in flights and passengers for the year ahead. A reasonable starting point is to investigate the forward-looking schedule. That is, after all, a clear statement of intent by a carrier as to the future size and shape of its schedule over the coming year.

    It is true that plans may change, especially in contact with real world events – witness the near chaos during the early months of the pandemic. But in normal times the variation is not unmanageable. The schedule published at the start of the 2025 for travel in June, for example, was around 5-6% ahead of the eventual plan as the month arrived.

    Applying data science models to the schedule further reduces the difference, not to mention giving insights into the equipment flown. And as models improve, so do the estimates. Based on actual observed flying, Cirium has had success predicting seats flown within a percentage point or so, some 90 days out. That makes sense given that this is the typical selling period for a flight. For the same reason, changes are less marked once an airline has officially announced its summer or winter schedule.

    Even allowing for the gap between actual and scheduled flying, differences between airline plans are significant. As the peak summer months of July-September 2025 now approach, the industry’s overall growth in flights and seats (for airlines flying in both years), is set at just over 4%. Yet several US majors, such as Southwest, Delta and American, have filed schedules that are flat or even below those in 2024. So too have European mainline operators such as Lufthansa or British Airways. Other carriers are in more expansive mood, such as Turkish Airlines, Pegasus or LATAM Brasil, all showing bullish double-digit growth.

    Source: Cirium Core

    The number of seats offered, in turn, provides a reasonable proxy for the passengers flown. Load factors – the percentage of seats filled – tend to be relatively stable within a percentage point or two, assuming no major external events. It is a key task for airline revenue management teams to keep them so by varying fare levels. Building in other available factors, such as for seasonality, route type and aircraft configuration, will further refine the model.

    Passenger liability

    Answering the second half of the question, around nationality, is more intricate still. Short of studying the manifest, it is not possible to be certain about the number and nationality of travelers on a particular flight on any given day. Here too, there is a growing collection of potentially useful proxies to borrow from the air transport industry, which is itself now engaged in gaining a better understanding of directionality of travel and passenger segmentation.

    One big clue is available from Point of Sale (POS) data collected through the global agency booking channel. The high-density market between Western Europe and North America (USA and Canada) helps illustrate the point. The advance of joint venture services has long-since ended any simple assumptions that flag-carriers predominantly serving their own nationals.

    POS data for 2024 suggests that while the overall market swung toward North America, likely helped by a strong US dollar, carriers from Western Europe carried just over half of all travelers. In other words, European carriers increased their share of US originating traffic.

    Source: Cirium Core

    British Airways, KLM and Lufthansa each had more than 40% of passengers starting their journey on the opposite side of the Atlantic, while Air France posted a small majority. US majors carried higher shares of their own nationals, but still collectively with a third from Europe. Also worth noting that 4% of passengers came from other world regions.

    Admittedly the data is not perfect. The location from where a ticket is purchased does not necessarily confirm the nationality of the buyer. Agencies, especially online, may channel ticketing through a central regional hub, masking the true location of the booker. The data is also only a sample, albeit a large one. At an aggregate level, though, it provides a fairly consistent regional picture, and the data is only getting better.

    Other sources of location data, including from consumer search and spend, look promising in providing deeper clues, not only to point of origin, but also to the demographic of the traveler, often otherwise limited to cabin class and booking source.

    A smart combination of both network analytics and point-of-origin could perhaps finally begin to add some deeper colour in answering that simple question over future passenger numbers and nationality.

    This article was originally published in Cirium’s Aviation Data in Insurance report. For more insights and analysis into the evolving role of data in aviation insurance, read the full report.