Asset Watch
Accurately track flight and ground activity of a portfolio of aircraft

Asset Watch is part of Cirium Ascend®, providing aircraft analytics to empower businesses around the world to make dial-shifting financial risk, investment growth strategy and market assessment decisions.
Tracking aircraft utilization and the flight and ground activity is crucial for improving operational efficiency, managing costs, ensuring safety and compliance, facilitating strategic planning, addressing environmental concerns and proactively managing maintenance.
Fast, flexible, and configurable, Cirium’s new Asset Watch tool enables aircraft lessors, banks, insurers, maintenance, repair and overhaul (MRO) and airlines to monitor and benchmark aircraft utilization, identify flight history of aircraft and access the exact location, duration and context of aircraft on the ground.
Businesses can combine Cirium’s advanced EmeraldSky CO2 emissions data with the aircraft utilization to compare the emission efficiencies of different aircraft and engine types and inform strategies to reduce the CO2 emissions of a portfolio.
Gain access to the most complete aircraft data and analytics combined with industry standard flight intelligence via a flexible and easy-to-use configurable analytics tool.
Asset Watch product demonstration
Mitigate operational and financial impact, understand the market landscape and identify business opportunities with Asset Watch
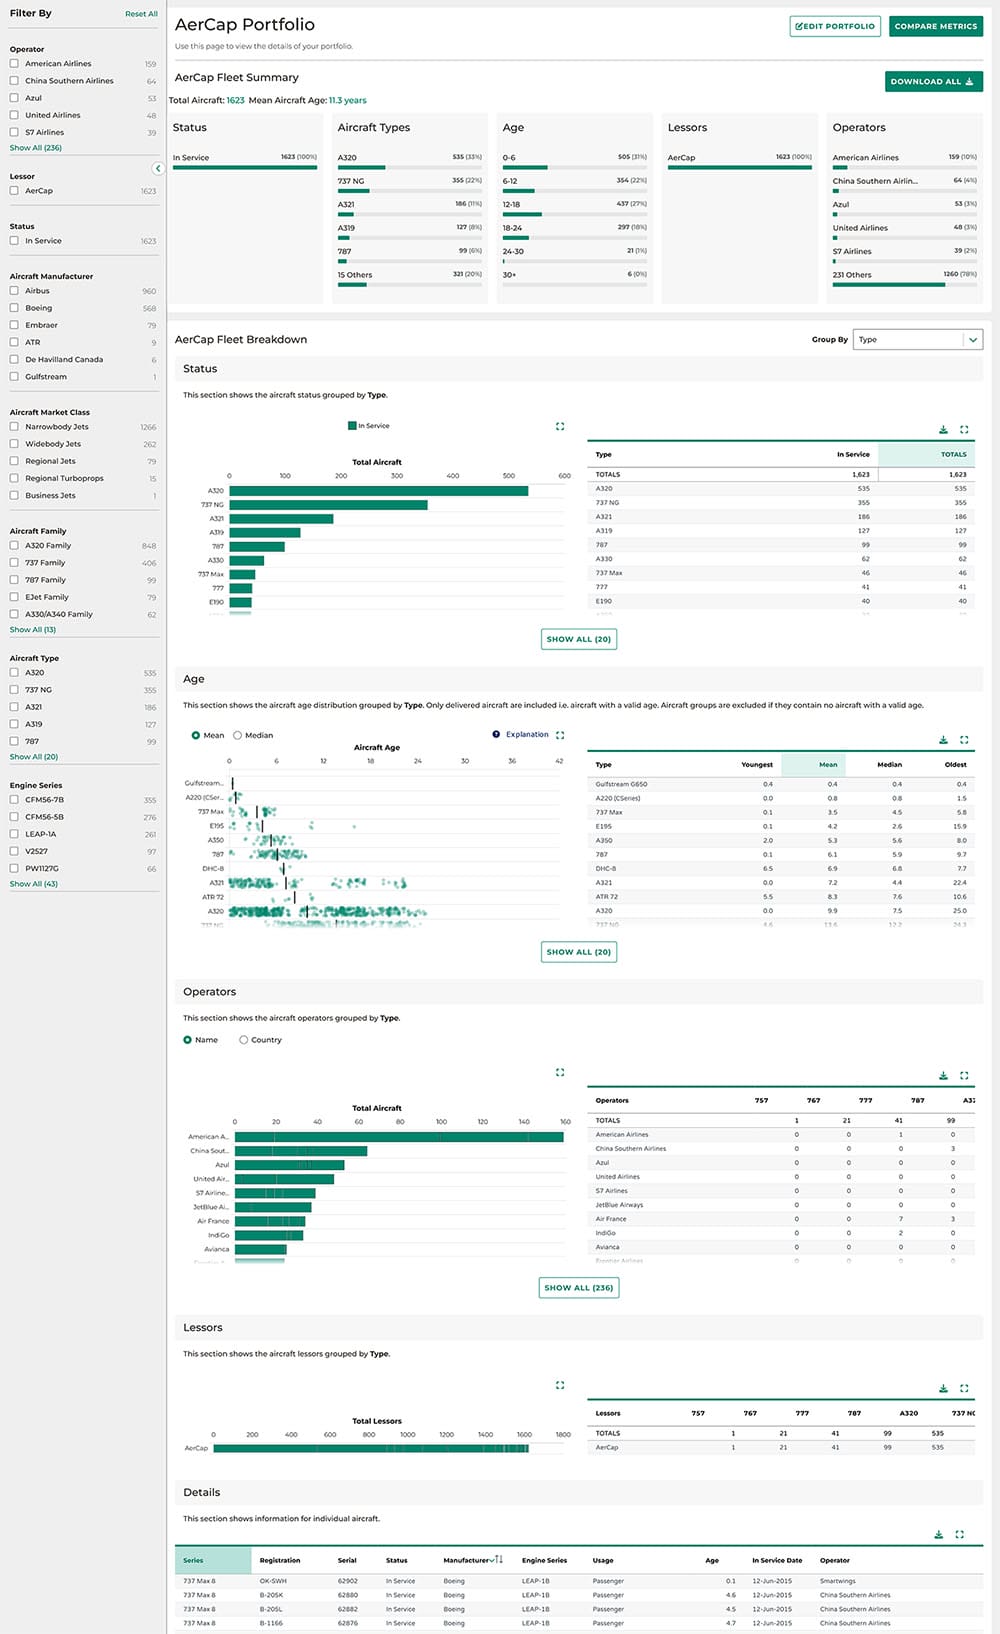
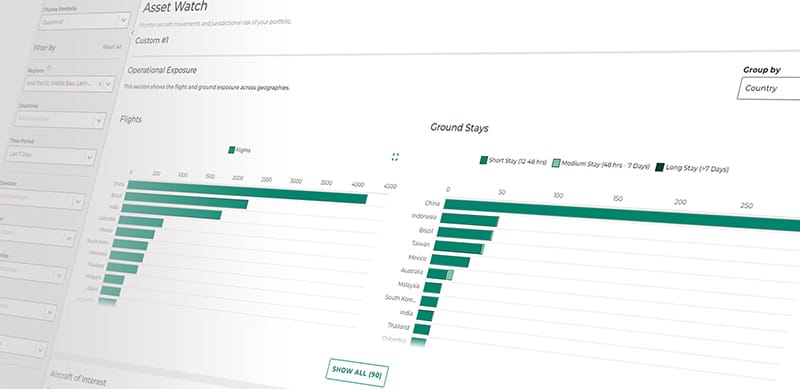
Asset Watch provides daily updated analytics on global aircraft movements. It combines Cirium’s advanced tracked aircraft utilization data with satellite-based flight tracking so that businesses can create custom aircraft portfolios, fleet information and aircraft utilization trends with precise aircraft movements and contextual ground stay insights on top.
Enabling improved monitoring of aircraft in a portfolio, effectively tracking its location and details, mitigation of any financial impact and forms of non-compliance, optimization of a fleet of aircraft, and identification of market opportunities with airlines.
Get market intelligence today
Used by airlines and alliances, airports. MROs, tourism, government authorities and more.
New features: saved searches and alerting
With the new Asset Watch features businesses can create custom portfolios of aircraft and set up alerts to proactively track their flights and ground stays based on selected criteria. Receive daily updates direct to email when criteria are met.

Gain access to Cirium’s advanced tracked utilization data and satellite-tracked flight data providing the most complete coverage of all modern aircraft globally. Since integrating satellite data from Aireon, the aircraft identification coverage has increased to 91% for scheduled flights and from 10,000-15,000 flights per day to 50,000-60,000 for unscheduled flights. Leverage industry standard ground stay information and identify any risk associated with a ground stay.
Customize visualizations surfacing high-quality data with ease and speed, saving time and effort spent on analyzing aircraft movements and ground stays in a portfolio. Quicker action based on reliable data can lead to effective reporting on aircraft utilization and can enable the mitigation of any financial impact because of operations to sanctioned countries, repossessions or global macro events.
Understand which airlines operated which aircraft types to airports and identify the airlines with short ground times at specific airports. Assess and compare the aircraft utilization against other portfolios and/or competitors, using multiple filters such as by country and airport groupings, and with thresholds which can be applied to the total flights and ground stay durations.
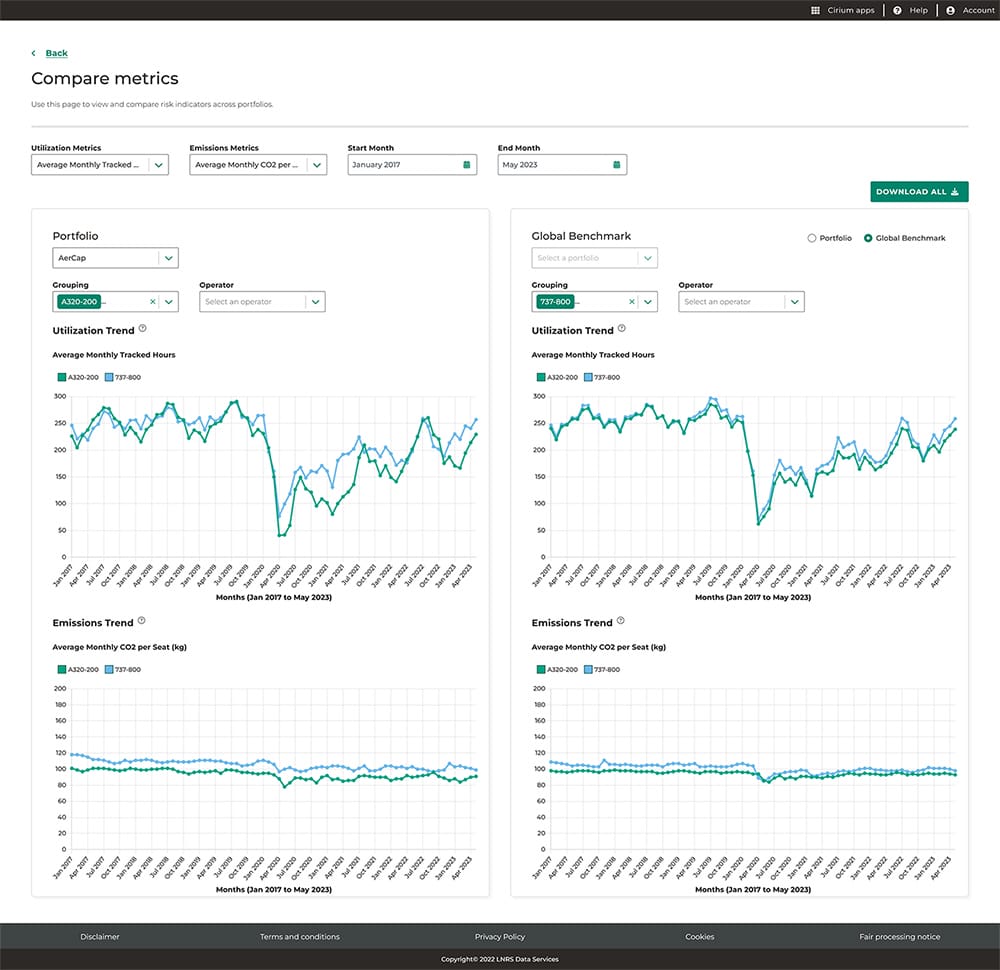
Search and filter by multiple attributes including individual aircraft, operator, lessor and more and compare custom portfolios. Benchmark a portfolio and their key metrics against other portfolios or global fleet averages, comparing key utilization and emissions metrics to inform ESG reporting or strategies to reduce CO2 emissions and identify low aircraft utilization.
Unrivaled tracked aircraft utilization and ground stay analysis
Lessors
Proactively monitor and mitigate regulatory risks related to current assets’ operations in sanctioned countries. Address financial risk arising from aircraft being flown when it’s not supposed to be, as well as repossession risk due to operations int conflict zones. Spot early signs of a slowdown in operations. This will help in better managing aircraft assets according to contract terms and industry standards.
Banks
Enhance aircraft portfolio monitoring to minimize financial impact and forms of non-compliance. Proactively monitor and mitigate any operational risk associated with aircraft assets, particularly with aircraft flying or spending time on the ground in sanctioned countries and conflict zones.
Insurers
Analyze the duration, location, and reason for an aircraft being grounded. Assess potential risks associated with the grounding of aircraft and determine if policy terms and limits have been breached or if sanctions have been violated.
Aftermarket Service Providers
Study ground stay patterns by airlines and aircraft types at specific airports to identify new business opportunities while also better planning service during aircraft turnarounds.
Airlines
Optimize the use of aircraft in a portfolio and inform fleet and maintenance planning decisions by monitoring and comparing the aircraft utilization against competitors, analyzing entry-level ground time information and assessing sub/leased airline fleet to ensure compliance.
Add CO2 emission insights
With the fast, flexible and configurable Asset Watch tool, businesses can add CO2 emissions reporting, benchmarking and scenario modeling to the tool. Emissions calculations are based on the EmeraldSkyTM methodology.
Identify carbon emissions of a portfolio and quantify how next generation aircraft types or aircraft utilization are lowering or could lower carbon footprint. Compare emissions of a portfolio with competitors and industry standards.
What’s included in Ascend Value Trends?
Precise aircraft movements
Asset Watch brings leading tracked utilization, flight tracking and ground stay data together to identify exact locations of aircraft and on-the-ground information.
Satellite-based aircraft tracking
Integrated advanced tracked hours and cycles data from Aireon, providing almost 100% coverage of commercial aircraft globally.
Largest fleets database
Data on over 450k unique aircraft records across over 770 aircraft types. Includes data on over 2.4bn aircraft events and over 300 attributes per aircraft. Fleet attributes automatically update in Asset Watch.
Unlimited custom portfolios
Create and manage custom groups of aircraft with ease. Saving significant time versus traditional methods of deriving custom insights around aircraft utilization and emissions.
Comparison of metrics
Benchmark a portfolio against other portfolios or global fleet averages, comparing key utilization and emissions metrics by month.
Multi search and filters
Manipulate the data by country and airport groupings and dive into MSN and flight-level details. Apply thresholds to Total Flights and Ground Stay data to narrow down the Aircraft of Interest.
Industry expert data team
Fleets data experts with decades of experience, making 2.7k new updates for 1.3k unique aircraft on average per week. Flight data experts making sense of over 200,000 flights per day.
Fuel burn and CO2 emissions
CO2 emissions outputs commended by American Airlines and Virgin Atlantic for accuracy and endorsed by Zurich Insurance.
Detailed flight history
Asset Watch shows detailed flight history by MSN for the selected time period. Businesses can get a sense of arrivals, departures, and ground time by date for the selected airport or country.
Unified Cirium access
Access the highly dynamic tool using Cirium Ascend’s common interface, complimentary to other Ascend products such as Fleets Analyzer, Ascend Profiles and more.
Flexible and configurable
Customize visualizations, drilling into detailed aircraft utilization and flight information and download the custom views created to support reporting and analyses.
24/5 customer support
15-person customer support team with a consistent 90%+ satisfaction score.