




























Finlay Grove, Product Manager Ascend, Cirium
Cathay Pacific’s widebody transformation is not simply a recovery story. It shows how coordinated fleet, maintenance and network planning decisions can translate directly into measurable operational and financial outcomes. This analysis highlights the role aerospace partners have played since 2023 in reducing down-time whilst returning more than 40 aircraft to service.
Cathay Pacific in 2023 ranked among operators with the lowest widebody utilization globally. Cathay were in the lowest quartile for Airbus A330s and last among Boeing 777 operators with 10 or more aircraft. Two years on, that picture has changed remarkably. By the end of 2025, the carrier had roughly doubled both its A330 and 777 fleets, while simultaneously lifting operating time by 2 percentage points on the A330 and 13.9 percentage points on the 777. The successful reintegration A330s and 777s shows the value and quality of Cathay’s relationships with aerospace partners. The success has enabled Cathay to expand their network and serve ultra-long-haul routes with their A350s with significant financial outcomes, delivering $10.1bn in passenger revenue and a net profit of $1.4bn in 2025, up 543% versus 2019.
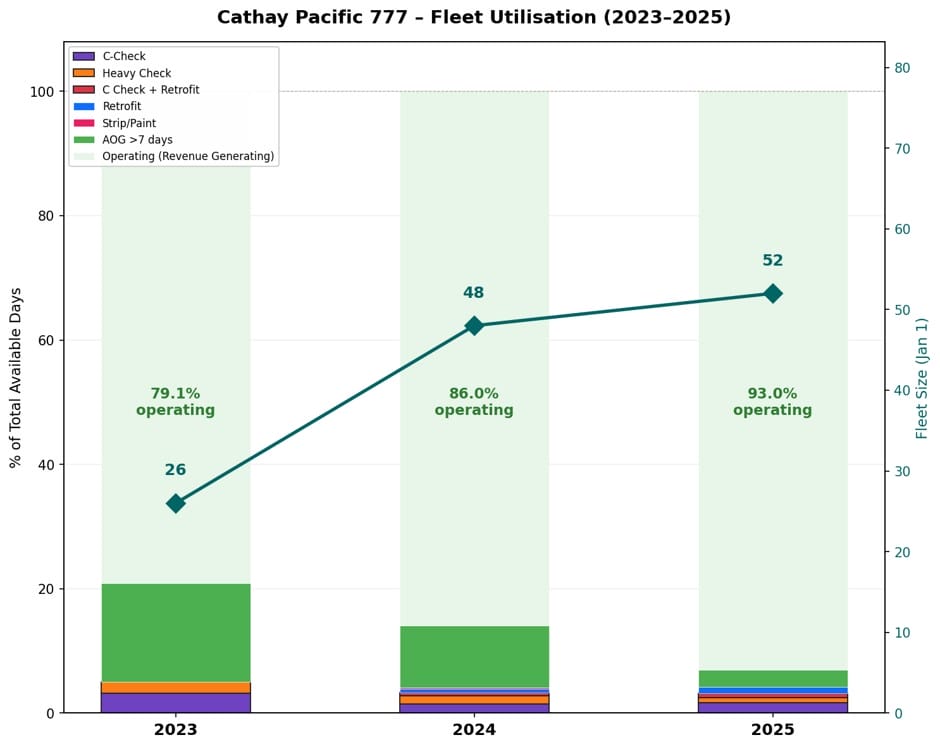
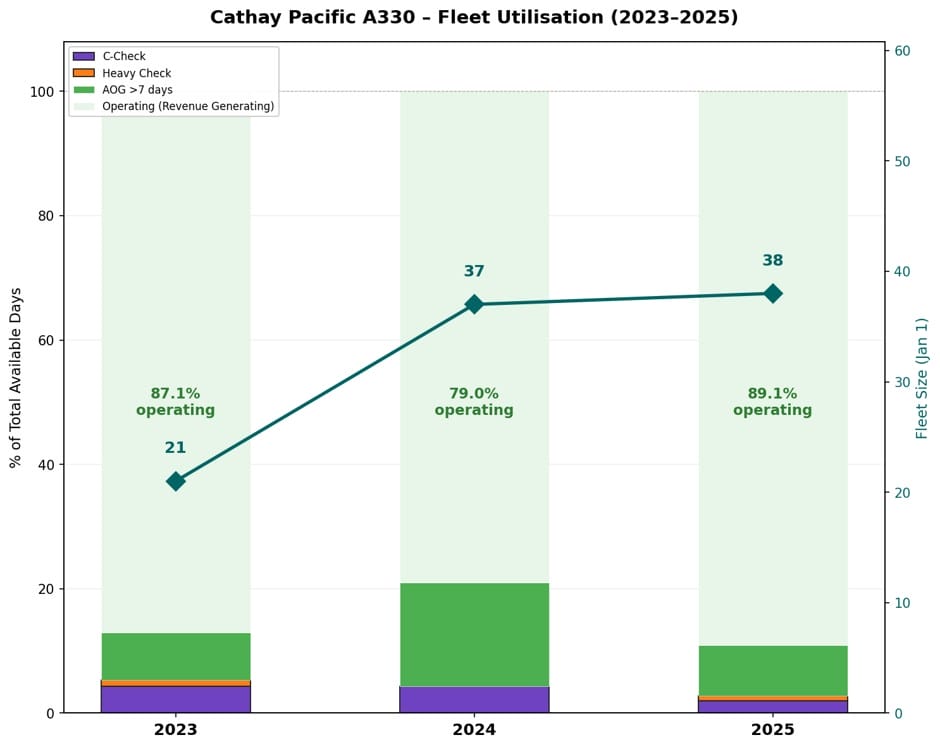
The scale of the change is clear, but the drivers behind it are more important than the headline numbers. Fleet growth alone explains a large share of the improvement, yet a meaningful portion has come from increased productivity per aircraft. This distinction matters beyond airline operations. Across aerospace, additional capacity does not guarantee additional output. Performance depends on how effectively existing assets are utilised.
Fleet Planning: Returning 777s and A330s from storage
In 2023, Cathay’s 777 fleet operated at 79.1% of available days, with each aircraft spending 26 days in scheduled maintenance and a further 84 days in AOG events across the year. By 2025, fleet utilization had risen to 93%, while maintenance time reduced significantly and AOG days fell sharply. Combined with fleet growth, this resulted in 6,625 additional operating days, equivalent to roughly 18 additional aircraft operating full-time for a year.
| Factor | 2023 vs 2025 Total 777 Fleet Available Operating Days |
|---|---|
| Reduced maintenance times | +76 |
| Reduced AOGs >7 days | +1,488 |
| Increased fleet size | +5,061 |
| Total | +6,625 |
Fleet growth contributed the majority of this increase, but the remaining improvement was delivered through better operational execution. The reduction in AOG events stands out as the single largest driver outside fleet expansion, highlighting how unplanned downtime directly constrains effective capacity. This is particularly relevant for MROs and aftermarket providers, where anticipating and preventing extended ground events is central to both operational efficiency and commercial performance.
The A330 story follows a similar trajectory, although with more variability during reintroduction. In 2023, the fleet operated at 87.1% of available days, with significant time spent in both scheduled maintenance and extended AOG events. By 2025, scheduled maintenance time had been compressed while per-aircraft AOG days also declined despite overall fleet growth. The result was 3,181 additional operating days, equivalent to around nine additional aircraft in service.
| Factor | 2023 vs 2025 Total A330 Fleet Available Operating Days |
|---|---|
| Reduced maintenance times | +208 |
| Reduced AOGs >7 days | -328 |
| Increased fleet size | +3,301 |
| Total | +3,181 |
The temporary increase in AOG during 2024, followed by a strong recovery in 2025, also illustrates the complexity of fleet reintroduction at scale. It reinforces the importance of managing not just planned maintenance, but the variability and unpredictability of unplanned downtime.
Maintenance Planning: Type-specialization as a performance driver
By 2025, each widebody type within Cathay’s fleet had a designated primary MRO partner. The 777 programme, long centred at HAECO Xiamen, demonstrates the benefits of this model, achieving near best-in-class C-check turnaround times. Cathay has extended this approach across its A330 and A350 fleets, consolidating volumes with specific providers and allowing operational experience and efficiency to compound.
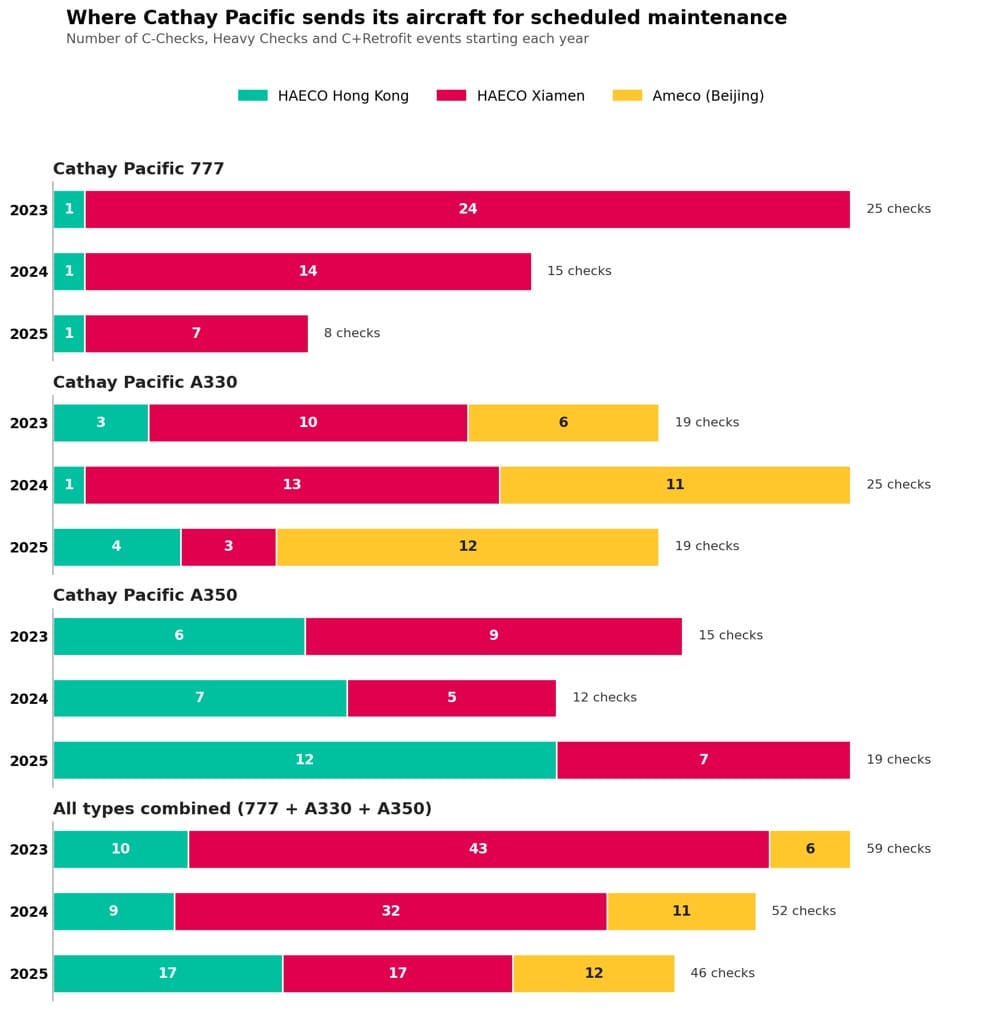
The A330 transition to Ameco Beijing reduced median C-check turnaround times by approximately seven days, while enabling HAECO to prioritize the 777 programme. This reflects a broader operational principle. Concentrating maintenance with fewer, specialized providers reduces variability, improves predictability and ultimately increases aircraft availability.
Cathay’s example follows a broader trend for top airlines where aircraft availability is the dominant economic driver when selecting MRO, OEM and aftermarket partners. Organizations that can anticipate maintenance demand and align capacity accordingly will consistently outperform those that react only once aircraft enter the hangar. This requires visibility beyond internal schedules, using utilization and ground-event signals to identify demand before it materializes.
Network Planning: A fleet strategy built around distinct stage lengths
Beyond fleet reactivation, Cathay’s network strategy reveals a clear shift toward aircraft-type specialization. As 777s returned to service, A350s were redeployed onto longer sectors, while A330s remained focused on shorter routes. By 2025, each aircraft type was operating within a more clearly defined range of stage lengths, aligned with its economic strengths.
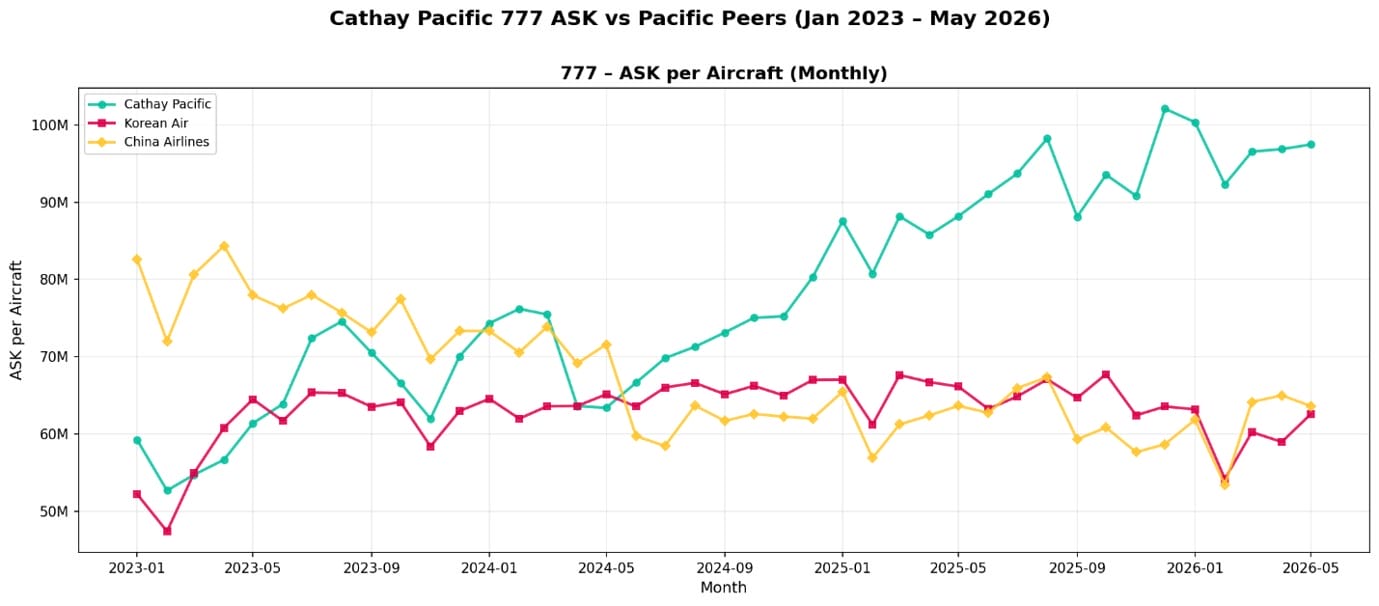
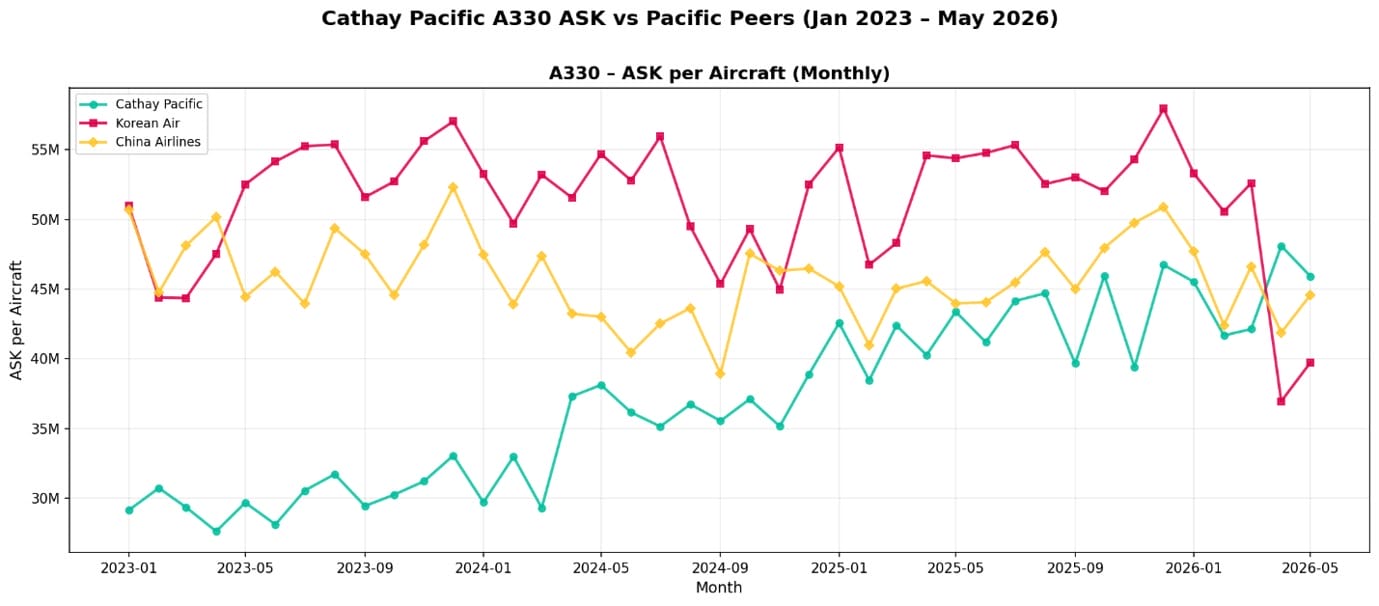
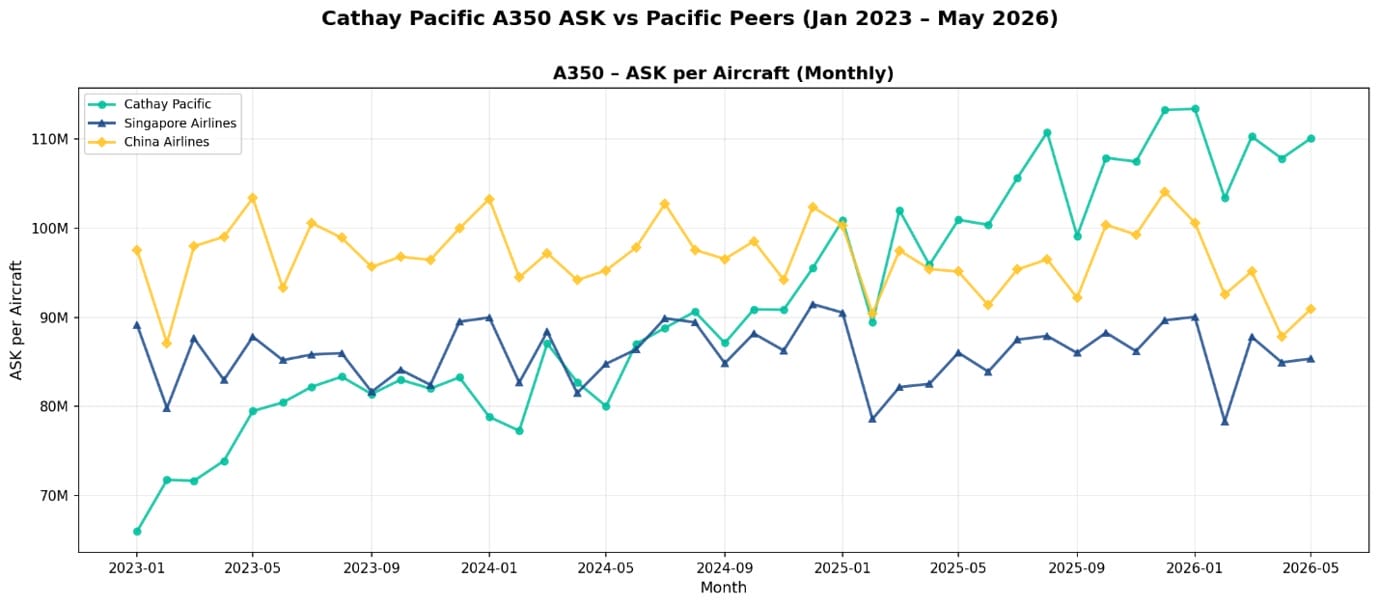
This structure has enabled more efficient deployment across the network. The 777 fleet expanded its route footprint while maintaining consistent stage lengths, while the A350 moved into longer-haul operations. In contrast, some competing carriers continued to deploy multiple widebody types across similar route profiles, diluting utilization gains.
| Aircraft Type | Operator | 2023 Av. Stage Length km | 2023 Av. Stage Length km | 2025 Av. Stage Length km |
|---|---|---|---|---|
| China Airlines | A330 | 1,738 | 1,708 | 1,725 |
| 777 | 6,136 | 6,061 | 5,897 | |
| A350 | 5,399 | 5,753 | 5,896 | |
| Cathay Pacific | A330 | 1,625 | 1,688 | 1,752 |
| 777 | 5,040 | 4,968 | 5,106 | |
| A350 | 5,769 | 6,272 | 7,292 |
The implication for aerospace stakeholders is that aircraft value is increasingly linked to how precisely assets are deployed in service. For OEMs, this affects product positioning and demand forecasting. For aftermarket providers, it determines where and when maintenance demand will emerge. Understanding real-world utilization patterns across the global fleet becomes central to aligning production, inventory and commercial strategy.
Operational results
The combination of improved maintenance execution and clearer fleet deployment has driven significant increases in productivity. ASK per aircraft has risen materially across all widebody types, with the strongest growth observed on the 777 fleet. These gains have translated into a growing share of ASKs across Cathay’s operated network.
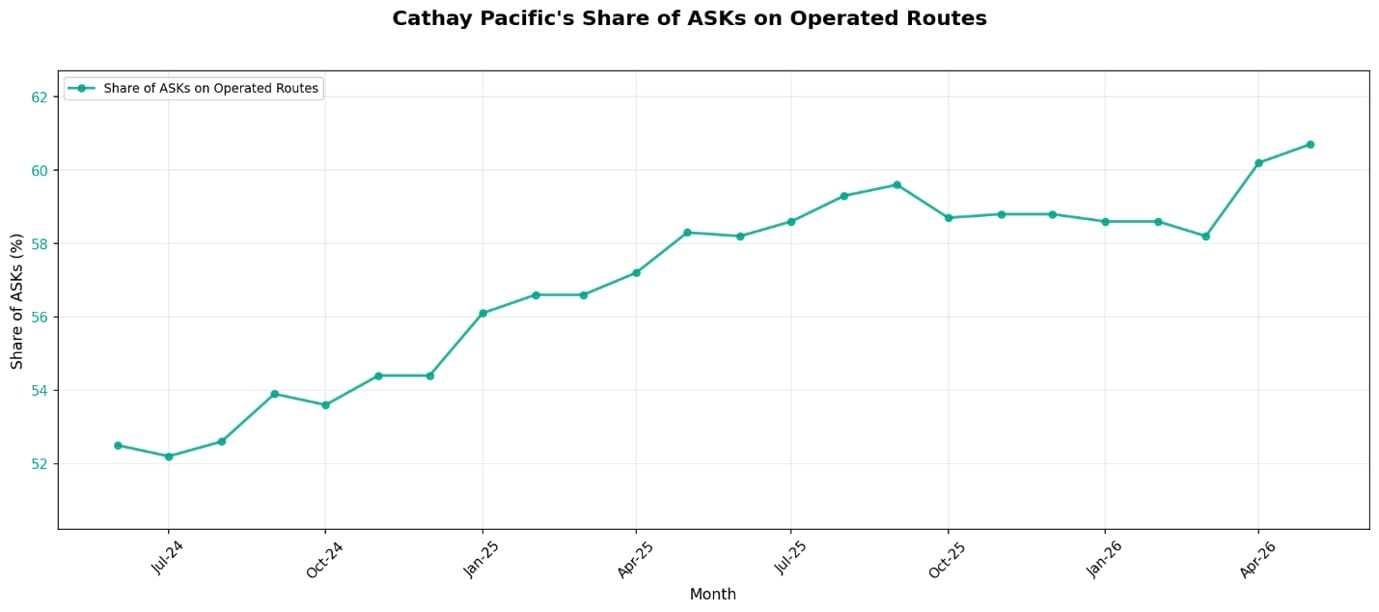
The compounding effect is important. Reduced downtime increases available capacity. More effective deployment increases utilization of that capacity. Together, they drive sustained improvements in output without proportional increases in cost.
Contributing factors
External conditions have supported Cathay’s transformation. The expansion of Hong Kong International Airport’s runway capacity increased available slots, while shifts in global traffic flows redirected demand toward trans-Pacific routes. However, these factors alone do not explain the outcome with many carriers operating in the same area.
The differentiator was execution. Cathay was able to translate improved availability and clearer fleet roles into network expansion and revenue growth. Where customers place increasing emphasis on reliability and certainty, operators that can sustain utilization gains are better positioned to capture both demand and yield.
Future outlook
With a reintegrated and more productive widebody fleet, Cathay is operating from a significantly stronger position than in 2023. The combination of improved utilization, clearer fleet roles and supportive market conditions provides a foundation for further growth.
More broadly, this case reflects a wider shift across aerospace. Operational performance is increasingly determined by how effectively organizations integrate fleet, maintenance and network decisions, using external intelligence to act earlier and with greater confidence. Internal data alone explains what has already happened, while the market moves ahead.
Organizations that can see these shifts forming across the global fleet, anticipate demand and align capacity in advance will be best positioned to reduce downtime, manage risk and capture emerging opportunities.
Aircraft availability is ultimately a shared outcome, shaped by how closely airlines and aerospace partners align on maintenance, capacity and execution. Strong, coordinated relationships are critical to keep aircraft off the ground and in service.
Organisations that adopt this approach will move faster, manage risk more effectively and capture value earlier.