Category: Industry

  • Greenwashing in Aviation: The Need for Accurate Emissions Data

    In recent years, the aviation industry has come under increasing scrutiny for its environmental claims, driven by regulatory oversight and growing demands from consumers and investors for genuine sustainability efforts. Greenwashing—misleading or exaggerating such claims—poses significant reputational, financial, and legal risks for the aviation industry. Addressing this issue requires a shift toward transparency and the adoption of accurate, data-driven approaches to emissions measurement. The following Q&A explores the risks of greenwashing, the limitations of traditional emissions reporting, and how advanced analytics can help the sector move forward with credibility and confidence. 

    Q: What is “greenwashing” in the aviation industry? 
    A: Greenwashing refers to the practice where airlines make invalid or misleading claims about their environmental efforts. This can involve exaggerating the impact of sustainability initiatives, leading consumers and stakeholders to believe the company is more environmentally friendly than it actually is. 

    Q: Why is greenwashing a significant issue for airlines? 
    A: Greenwashing poses several risks. It erodes public trust and investor confidence, which can damage a brand’s reputation. It also attracts regulatory scrutiny, as seen with the European Commission’s 2024 action against 20 airlines, potentially leading to significant financial and legal consequences. 

    Q: How does greenwashing affect an airline’s relationship with investors? 
    A: Investors are increasingly using Environmental, Social, and Governance (ESG) criteria to guide their decisions. Greenwashing creates uncertainty and undermines a company’s credibility, which can deter environmentally conscious investors and limit an airline’s access to capital. 

    Q: Why are traditional methods of calculating carbon emissions becoming insufficient? 
    A: Many traditional carbon calculators rely on broad estimates and assumptions that do not account for critical variables like aircraft type, engine efficiency, or actual fuel burn. This can lead to imprecise and inconsistent data, making it difficult to report progress accurately or comply with evolving regulations. 

    Q: What is the solution to inaccurate emissions reporting? 
    A: The industry needs to adopt an independent monitoring system that provides reliable, verifiable, and scientifically accurate emissions data. This approach enhances transparency, supports regulatory compliance, and builds trust among customers, investors, and regulatory bodies. 

    Q: How can advanced analytics improve emissions measurement? 
    A: Advanced analytics platforms, such as Cirium’s EmeraldSky, use cutting-edge techniques and a wide range of proprietary data to calculate CO2 emissions with unparalleled precision. By analyzing specific flight and aircraft details, these tools move beyond general estimates to provide an accurate measure of fuel burn and emissions for both flown and forecasted flights. 

    Q: What is EmeraldSky? 
    A: EmeraldSky is an advanced methodology developed by Cirium that integrates extensive data and analytics to achieve a highly precise measurement of aircraft CO2 emissions. It provides the industry with the accuracy and transparency required to meet environmental commitments and support credible sustainability reporting. 

    Q: What actionable steps can airlines take to combat greenwashing? 
    A: Airlines should commit to transparency by using independent, verified data for emissions reporting. Investing in advanced analytics will allow for precise measurement and optimization. It is also important to communicate sustainability strategies clearly, using verifiable data to back all claims and foster collaboration across the industry to establish a universal standard for emissions measurement. 

    In summary, addressing greenwashing in aviation is not only a regulatory challenge but an opportunity to strengthen trust, safeguard reputation, and build a resilient pathway to net-zero. Through transparent practices and the application of accurate, science-based emissions data, the industry can demonstrate true progress, meet stakeholder expectations, and support broader sustainability objectives. 

  • Golden Week: Domestic Dominance, International Growth Trends

    Harry Chan, Head of Greater China, Cirium

    • Japan, South Korea, Hong Kong SAR, Thailand and Singapore account for 50% of China’s total international seat capacity.
    • Japan maintains its position as the most popular destination, with South Korea following closely behind.
    • Southeast Asia presents mixed results, with Vietnam, Malaysia and Singapore growing in popularity, while Thailand declines.
    • Shanghai Pudong Airport (PVG) continues to dominate as China’s primary international hub.

    As China’s National Day Golden Week approaches, the aviation industry is closely examining seat capacity trends to prepare for this peak travel period. Taking a look at Cirium’s data between 29th September and 10th October across the years, we are able to identify shifts in both domestic and international travel trends, destination preferences and key aviation hubs.  

    A detailed examination of seat capacity, particularly on international routes, offers comprehensive insight on how airline operations can strategically plan to meet the expected surge in demand during this holiday period.

    Domestic travel remains strong while international growth surges

    Source: Cirium SRS Analyzer, scheduled seat capacity between 29 September to 10 October 2025.

    In recent years, the National Day Golden Week holiday season has seen a consistent upward trend in overall seat capacity, propelled by the surge in domestic flight capacity. Since 2024, domestic flights have accounted for over 90% of the total capacity, marking a significant increase from the 87.7% in 2019. This reflects the growing preference for travel within Mainland China.


    While domestic flights continue to take up the majority of market volume, international capacity is expanding at a rapid pace. Between 2024 and 2025, international seat capacity is projected to grow around 10%, outpacing the modest 4% growth seen in domestic capacity.  This points to a renewed and growing appetite among Chinese travelers for overseas destinations, even as domestic travel remains dominant.

    Source: Cirium SRS Analyzer, scheduled seat capacity between 29 September to 10 October 2025.

    Interestingly, the top five countries/regions (Japan, South Korea, Hong Kong SAR, Thailand and Singapore) accounts for 50% of China’s total international seat capacity.

    A detailed look at the top 10 international destinations shows a dynamic shift in traveler preferences. Japan leads as the most popular destination for Golden Week 2025, recording a 17.6% year-on-year increase in seat capacity. South Korea retains a strong second place, reinforcing East Asia’s continued appeal.

    Southeast Asia has experienced the most notable change, showing an overall decline of approximately 8% compared to 2019. Thailand, once the top destination in 2019, has dropped to the fourth position, with seat capacity now nearly halved since its peak in 2019. In contrast, Vietnam has seen outstanding growth of more than 53% since 2024, highlighting its rising popularity. Singapore and Malaysia continue to gain momentum, posting gains of 7.3% and 12.6%, respectively.

    One noteworthy shift in the top 10 list is the absence of the United States, which was ranked sixth in 2019. Current geopolitical developments and travel constraints may have shifted demand towards destinations closer to China.

    Key airports supporting Golden Week travel

    Source: Cirium SRS Analyzer, scheduled seat capacity between 29 September to 10 October 2025.

    Source: Cirium SRS Analyzer, scheduled seat capacity between 29 September to 10 October 2025.

    Shanghai Pudong Airport (PVG) continues to assert its dominance as a pivotal international hub in the country, with a 10.4% increase in seat capacity from 2024. Following closely behind is Beijing Capital Airport (PEK)and Guangzhou Baiyun Airport (CAN), reinforcing these hubs as crucial gateways for both domestic and international travelers.

    Other than the obvious lead destination above, emerging destinations like Hanoi and Ho Chi Minh City have experienced significant growth in seat capacities over the past two years, increasing from rank 35 and 25 back in 2019, but now ranking at 11 and 13 respectively.

    Source: Cirium SRS Analyzer, scheduled seat capacity between 29 September to 10 October 2025.

    Seven of the ten busiest outbound international routes originated from PVG. China’s top international route is Shanghai Pudong to Osaka Kansai (PVG-KIX), which surged 35%, propelling it from fourth position in 2019 to first position in 2025. Similarly, Shanghai Pudong – Tokyo Narita (PVG-NRT) has also increased 14% compared to pre-covid days, noting an increasing attraction towards Japan.

  • GTF-equipped A320neos dominate lessors’ in-storage fleet in 2025

    Andrew Doyle
    Andrew Doyle

    Andrew Doyle, Senior Director, Market Development, Cirium

    By mid-July over half of operating lessor mainline passenger jet aircraft in storage were Airbus A320neos powered by Pratt & Whitney PW1100G geared turbofan (GTF) engines, Cirium Fleets Analyzer data shows. However, the vast majority of these were placed with operators, leaving only 38 – most of which were formerly operated by the now defunct Go First of India – designated as off-lease.

    Fleets Analyzer reveals nine lessors have 33 stored GTF-equipped neos that were with Go First, while two had been operated by VietJet Air and three by IndiGo. Cirium Ascend Consultancy estimates there are only around 140 additional off-lease single-aisles of all types in storage, plus around 20 widebodies.

    Meanwhile, the overall stored GTF A320neo fleet has stabilised at approaching 500 aircraft – principally due to the shortage of engines caused by well-documented powdered metal contamination issues – while the inactive inventory of all other models declined from a 12-month peak of almost 800 in January 2024 to around 480 by July 2025.

    Excluding GTF A320neos, the average age of stored operating lessor aircraft has increased from 12 years in July 2022 to 15.4 years for the same month in 2025.

    Source: Cirium Fleets Analyzer

    A net total of approximately 150 operationally leased 737-800s and A319/A320ceos entered storage between August 2023 and January 2024. However, these types have since seen a resurgence in demand thanks to the ongoing GTF issues and the supply chain difficulties preventing new aircraft production rates reaching planned levels.

    Operating lessors in July accounted for almost 1,500 delivered GTF-powered A320neo family single-aisles, of which just over a third are inactive. Of the top 30 lessors for this type (with portfolios of 10 aircraft or more) AerCap and SMBC Aviation Capital’s airline clients have seen the biggest impacts in terms of absolute numbers, although some smaller lessors have a greater portion of their smaller portfolios on the ground.

    Overall, fewer than half of the approaching 2,300 Airbus and Boeing passenger aircraft listed by Cirium as stored in July 2025 were operating lessor-managed. However, collectively they managed more than 83% of the just over 600 stored GTF A320neos.

    Meet the Cirium team at ISTAT EMEA 2025.

    Hear from Stephen Burnside, incoming Global Head of Cirium Asend Consultancy, Tuesday 7th October 2025 at 14:00.

  • How will airlines maximise value from the A321XLR?

    Cirium Ascend Consultancy is trusted by clients across the aviation industry to provide accurate, timely, and insightful aircraft appraisals. The team provides the valuations and analysis the industry relies on to understand the market outlook, evaluate risks and identify opportunities.

    Discover the team’s industry reports & market commentaries. Read their latest expert analysis, viewpoints and updates on Thought Cloud.

    Richard Evans airline consultant
    Richard Evans airline consultant

    Richard Evans, Senior Valuations Consultant, Cirium Ascend Consultancy

    With the first examples of the Airbus A321XLR variant now in service, the network plans for this sub-type of the extremely successful A321neo are starting to become clearer.

    There are now four airlines with aircraft in regular service, with at least two more to come by the end of 2025. It has not all been plain sailing for the new variant, however, with delays due to certification and seat supply issues. There has also been the news that Wizz Air is exiting the Abu Dhabi market, which calls into question its commitment to the XLR.

    Airbus does not formally split out variants within its A321neo order book. Cirium’s Fleets Analyzer currently shows a total of 15 aircraft delivered (11 in service and 4 currently stored), plus a firm order backlog of 461 units for commercial customers. This represents around 9% of the total A321neo backlog, but there could be additional commitments that have not been made public.

    To what extent the XLR is a niche version of the type, or not, is a relevant question for financiers and lessors, especially given the XLR commands a price premium for its capability. To illustrate this, Cirium’s Values Analyzer shows a Full-Life Market Value (FLMV) of $62.4m for a brand-new baseline A321neo (no ACTs, 93.5t Max Take-off Weight). This increases to $66.8m for an A321neo, with 3 tanks fitted and 97t MTOW. Although not an official nomenclature, this configuration is often referred to as an A321neo LR. For the XLR, FLMV increases to $71.9 million. For comparison, the smallest twin-aisle type currently in production, the 787-8, commands a FLMV of $127.9 million.

    A321XLR order book, as at 17 September 2025

    Operator regionOperatorDeliveredOn orderInitial deliverySeating layout (where known)
    Asia PacificAirAsia Group702027 
     Cebu Pacific92026236
     Drukair22030 
     IndiGo292025195
     Jetstar362027 
     Peach32030218
     Qanot Sharq32027 
     Qantas2172025200
     VietJet Air152026 
    EuropeAer Lingus422024184
     Azores Airlines12027 
     Iberia442024182
     Icelandair122027187
     Wizz Air Group3442025239
    Latin AmericaJetSmart Chile142030 
     LATAM Group52027 
     Sky Airline102026 
    Middle EastAir Arabia202028 
     Flynas102026 
     MEA42027160
     Saudia15  
    North AmericaAir Canada302026182
     Air Transat32027199
     American Airlines2482025155
     JetBlue (Aegean)132025138
     United Airlines502026150
    LessorsAerCap9  
     Air Lease Corporation18  
     Aviation Capital Group5  
     BOC Aviation10  

    Source: Cirium Fleets Analyzer

    The status of JetBlue’s order is unclear, with its first two aircraft destined for sale to Altavair on delivery, for onward lease to Aegean Airways. It also appears likely that the Wizz Air Group will convert some of its backlog to other versions of the A321neo.

    By the end of 2026, there are set to be at least 13 airlines flying the XLR, operating in a wide variety of seating layouts. Many, such as Aer Lingus, Air Canada, Aegean, American and United, will fly with lie-flat business class seats, in contrast to Wizz Air and other Low Cost Carriers (LCCs) flying with high-density seating layouts of 230-240 seats. Qantas plans two different layouts, with initial deliveries having a 37 inch pitch business product, but then others with full lie-flat business class for longer routes.

    The selling point of the XLR is additional range. Airbus markets the type as having a range of up to 4,700 nautical miles (nm), but this is subject to caveats. Firstly, this is the range with a standard dual-class seating configuration. Fitting more seats will mean less range. Secondly, real-world routings and headwinds generally cut the true capability, for great circle distances, by around 15%. Thus, the longest route that could be reliably flown year-round may be more like 4,000 nautical miles great circle. This is similar to London to Denver, or Sydney to Bangkok.

    For airlines configuring just 138-155 seats, the range capability may, conversely, be more than 4,000 nautical miles. These type of configurations, including business class and premium economy seats, are clearly aimed at high-yield premium markets.

    Airbus has not yet published a payload-range chart on its Airport Operations and Aircraft Characteristics website, but the below chart including the A321neo LR (97,000kg MTOW with 3 ACTs) highlights the issue of payload capability. It shows that for an LCC, such as Wizz Air with 239 seats, the aircraft is operating very close to its maximum payload of around 23 tonnes.

    A321neo payload-range capability

    Source: Airbus

    We believe the XLR will have a marginally higher empty weight than the LR, but that Airbus is looking to increase the MTOW from 101t to 101.5t to restore payload and/or range capability. It is thus likely that the XLR will have a similar maximum payload to the A321LR. This means that fitting 230 seats or more results in hitting maximum payload on routes with high luggage needs – typical of many routes to/from the Middle East, Africa, and Latin America. This is not an issue for network airlines, where they are fitting low-density dual-class or three-class layouts.

    The big question, therefore, is where do the XLR operators plan to fly their aircraft, and how far can they extend operations into markets previously only available to longer-range twin-aisle types?

    The longest routes currently flown by the initial operators are shown on the map below. Iberia’s Madrid-San Juan route is 3,448 nm great circle distance and Aer Lingus’s Dublin-Nashville flight is 3,394 nm. Wizz Air’s Gatwick-Jeddah and Milan-Abu Dhabi services are both around 2,550 nm. This highlights that the XLR is not really required for most Middle East to Europe operations, but also that the initial operators are not pushing the range out to anywhere near Airbus’s marketing figure. As an example, Etihad Airways recently stated it saw the A321LR as sufficient for its needs.

    Longest current A321XLR routes, November 2025

    Source: Cirium schedules data

    For reference, the longest A321LR route today is Sharjah to Kuala Lumpur by Air Arabia, with 215 seats, at 2,990 nm. This matches very well with the A321LR range in Airbus’s payload-range diagram of  around 3,500 nm, before track and headwinds are accounted for, at 21t of payload.

    Several other airlines have announced their initial A321XLR routes. Aegean has said it will fly to Mumbai (2,783 nm) and Delhi (2,697 nm) initially, potentially followed by Bangalore (3,216 nm). It will have a code-share partnership with IndiGo, who will also use its first XLRs on these two markets. Lastly, Air Canada will operate the type on Montreal to Edinburgh (3,031 nm), Toulouse (3,569 nm) and Palma de Mallorca. The latter is the longest route announced yet, at 3,777 nm, and will be a summer-only service.

    Analysis of existing and planned XLR routes indicates the real-world range network capability of the XLR (taking into account headwinds and track deviation) comes out more like 3,500-4,000 nm with low-density seat layouts, or considerably less for a 239-seat Wizz configured aircraft.

    To conclude, the A321XLR looks set to be a very important aircraft for many airlines, especially those seeking to maximise premium revenues on thinner business or leisure-focussed routes.

    For LCCs, it may be less attractive. For them, ancillary revenue is very important and flying longer missions does not necessarily maximise this. There may be more hold-bag fees and more opportunity to sell meals on longer flights, but there are fewer flights per day to do so. Having a sub-fleet of XLRs may also limit the ability to maximise asset utilisation across both short and long sectors.

    It is still too early to accurately forecast what proportion of the A321neo fleet the XLR will represent long-term. It may well be a relatively niche product, but has already been ordered by several influential major carriers. Liquidity could be an issue, but major network airlines tend to retain their aircraft longer, so this could be mitigated, such that the premium pricing for the type is justified.

  • Daily Emissions Peak Masks Aviation’s Big Efficiency Jump

    July 18, 2025, saw passenger jet operations generate 2.52 million tonnes of CO₂—0.1% above the previous daily record set in August 2019, according to EmeraldSky analysis from Cirium. The milestone caps aviation’s complete recovery from the pandemic collapse, but the path back reveals fundamental shifts in how the industry operates.

    Behind the seemingly modest 0.1% increase in total daily emissions lies a more complex story: airlines achieved a 7.4% improvement in fuel efficiency per available seat kilometer (ASK) while accommodating substantially more passengers. The mathematics of this recovery challenge long-held assumptions about the relationship between aviation growth and environmental impact.

    The Recovery Paradox

    Here’s what makes July 18 significant: airlines delivered 8.2% more ASKs than August 2, 2019 while increasing total emissions by just 0.1%. Flights crept up only 3.7% over six years, yet carriers found ways to accommodate surging demand through a wholesale reimagining of capacity deployment.

    The numbers tell the story. Average aircraft size grew by eight seats to 175 passengers per flight. Route distances stretched 3% longer to 1,626 kilometers on average. Flight times? They barely budged—up just 1.3% to 138 minutes despite busier airspace and longer routes.

    Efficiency Context

    The 7.4% efficiency improvement represents approximately 187,000 tonnes of CO₂ saved daily compared to 2019 operational standards, though absolute emissions still increased 0.1% due to capacity growth exceeding efficiency gains.

    When Plans Meet Reality

    The efficiency gains become more intriguing when viewed against operational headwinds. Flight-weighted average aircraft age jumped 17% to 11.6 years—exactly the opposite of what efficiency playbooks recommend. Post-COVID supply chain snarls and unexpected engine durability issues with newer aircraft meant airlines couldn’t simply buy their way to better performance.

    Instead, they had to extract more from what they had. The result: proof that operational innovation can deliver efficiency gains even when fleet modernization slows. It’s a finding that challenges conventional wisdom about the primacy of new technology in driving environmental progress.

    Fleet Reality

    Supply chain constraints and engine reliability issues resulted in older aircraft handling more operations than planned, yet airlines still achieved significant efficiency improvements through operational optimization.

    Beyond the Flight Plan

    EmeraldSky’s analysis goes deeper than standard industry calculations, which often miss 15-25% of actual emissions by relying on theoretical flight plans rather than operational reality. The system tracks 47 variables across more than 100,000 daily flights—everything from actual taxi times and routing changes to weight variations and holding patterns.

    This granular approach reveals efficiency improvements in unexpected places. Airlines didn’t just optimize cruise flight—they squeezed time from ground operations, streamlined routing coordination, and fine-tuned their networks. The 7.4% improvement represents the cumulative effect of hundreds of operational refinements, many invisible to passengers but clearly visible in the fuel burn data.

    Data Methodology

    EmeraldSky’s comprehensive tracking reveals operational efficiency improvements across multiple dimensions, including areas like ground operations and routing optimization that standard industry fuel burn calculations typically exclude.

    What 18 July, 25 Already Tells Us

    EmeraldSky’s real-time tracking confirmed what the industry suspected: July 18 was just the beginning. Emissions on 18 July 25 exceeded the 2019 record, and seasonal patterns suggest new peaks will become routine during Northern Hemisphere summer travel seasons.

    The question now isn’t whether aviation will set more emissions records—it’s whether the efficiency improvement trajectory can accelerate enough to bend the curve. With easier operational gains likely exhausted and sustainable aviation fuel still comprising less than 1% of consumption, the industry faces the mathematical reality that continued growth will require more fundamental changes to maintain environmental progress.

    Industry Analysis

    The 7.4% efficiency improvement over six years represents an annual rate of 1.2%, exceeding historical industry improvement trends but occurring alongside net emissions growth of 0.1% due to capacity expansion.

  • Air travel demand: Is it faltering?

    Thomas Sweeney - Cirium Ascend Consultancy
    Thomas Sweeney - Cirium Ascend Consultancy

    Thomas Sweeney, Valuations Associate, Cirium Ascend Consultancy

    As the summer winds down and we look ahead to a busy couple of months of conferences and events, I wanted to examine how risks to travel demand – which seemed unknowable six months ago – have been shaping up. In April when President Trump announced sweeping tariffs, the ensuing economic uncertainty was as large a risk to the aviation sector as the direct impacts of tariffs on aircraft trading. The latter continue to be defined and negotiated but the former have gained some clarity. The US market is naturally the most directly affected by recent events, though instability and contraction in the US economy will always have global ramifications. As the issuer of the world’s reserve currency and a major source of sovereign debt held globally, US economic instability quickly impacts global markets through shifts in dollar value, Treasury yields, and the productivity trends that underpin global growth expectations.

    Economists have been asking if the US is in a recession. Shortly after the tariffs were announced many were predicting one, albeit mild. Government data suggests that the economy is growing, and recession has been avoided so far [1]. However, a common view among economists is that growth in the country is highly unevenly distributed between both sectors of the economy, socioeconomic groups and geographical regions[2]. Large investments into AI have resulted in strong growth for companies developing and utilising the technology. A second major driver of growth has been by the wealthiest segment of Americans. The top 10% of earners account for nearly 50% of consumption[3]. Has the demand for air travel been buoyed by wealthy spenders and AI investment or is there weakness indicative of a weaker economy outside these areas?

    Growth in US capacity (ASKs) is correlated to overall GDP growth, amongst other factors. The correlation is not direct – there are specificities in the airline market distinct from the general economy – but the link is clear:

    Source: Cirium Core and Federal Reserve Economic Data (FRED)

    Zooming in to the most recent months, domestic capacity has been growing slower in 2025 than 2024 and, in some months, capacity has contracted.

    Source: Cirium Core

    Several US airlines cut capacity from Q2 onwards in response to the economic uncertainty caused by tariffs. Planned domestic and international capacity has been cut by up to three percent by US airlines.

    Source: Cirium Core

    Capacity growth is recovering in the later part of the year, potentially as the uncertainty has waned in recent months. Nonetheless, apart from 2020 heavily influenced by the Covid-19 pandemic, 2025 appears to be the weakest year for capacity growth in a decade.

    The picture is consistent with a growing economy for which there remains significant risk. Travel demand (and resulting capacity) within the US is exposed to the high-growth sectors of the economy, especially wealthy consumers who travel more frequently and in higher yielding cabins. Cutting capacity growth and focusing on premium travel can be a positive for airlines, allowing them to keep yields high. In the second half of 2025, capacity growth has been much slower in economy class seats, with business class seats remaining more robust.

    Source: Cirium Core

    Average US personal consumption expenditures have grown at their slowest level since 2020[4], which has been translating into the softening demand and capacity growth, even if it’s in lower-yielding cabins and sectors. Travel demand, like the US economy more generally, is likely to be highly sensitive to the consumption of the wealthiest segment of Americans. Any downturn which affects the spending habits of this group, such as a slump in AI confidence and investment, could impact air travel demand quickly. With risk concentrated in this way, close attention must be paid to economic signals for this group.

    The US domestic market is markedly weaker than other regions. Despite the impact of tariffs on other countries, most do not show significantly weakened economies as compared to the beginning of the year. Global scheduled ASK growth is healthy, sitting between 4% and 6% for most of this year.

    Source: Cirium Core

    Global demand is remaining strong. However, the nature of the global economy and financial system is such that issues in the US have an outsized influence globally. US growth is currently resting on a few small groups. Softening there could have downstream effects on not just the US domestic airline market but passenger demand globally. Therefore, it is critical that we continue to monitor the health of this market for warning signs and proactively consider how we will navigate those challenges.

    Meet the Cirium team at Airline Economics Growth Frontiers London 2025.

    Hear from Thomas on the SAF Panel, Thursday 18th September 2025 at 14:00. Eleni Maragkou will join the Lease Rates & Valuations Panel, Wednesday 17th September 2025 at 11:40.

    [1] fred.stlouisfed.org/series/GDPC1
    [2] www.ft.com/content/e9be3e3f-2efe-42f7-b2d2-8ab3efea27a8
    [3] https://www.wsj.com/economy/consumers/us-economy-strength-rich-spending-2c34a571
    [4] fred.stlouisfed.org/series/PCECC96

  • Passenger Liability: Read the Signs in Traffic & Schedules Data

    Kevin O’Toole, Chief Strategy Officer, Cirium

    How many passengers does an airline expect to carry over the next year, and of what nationalities?

    The question is deceptively simple, and seemingly crucial for anyone carrying exposure to passenger liabilities. As any underwriter knows, the answer has been far from straightforward. But there is now data out there, which, with the addition of a data science model or two, is helping to paint the pattern of future flying. It is, after all, what airlines themselves use to build network plans through tools such as Cirium’s Diio suite.

    Take the first part of the problem, around the change in flights and passengers for the year ahead. A reasonable starting point is to investigate the forward-looking schedule. That is, after all, a clear statement of intent by a carrier as to the future size and shape of its schedule over the coming year.

    It is true that plans may change, especially in contact with real world events – witness the near chaos during the early months of the pandemic. But in normal times the variation is not unmanageable. The schedule published at the start of the 2025 for travel in June, for example, was around 5-6% ahead of the eventual plan as the month arrived.

    Applying data science models to the schedule further reduces the difference, not to mention giving insights into the equipment flown. And as models improve, so do the estimates. Based on actual observed flying, Cirium has had success predicting seats flown within a percentage point or so, some 90 days out. That makes sense given that this is the typical selling period for a flight. For the same reason, changes are less marked once an airline has officially announced its summer or winter schedule.

    Even allowing for the gap between actual and scheduled flying, differences between airline plans are significant. As the peak summer months of July-September 2025 now approach, the industry’s overall growth in flights and seats (for airlines flying in both years), is set at just over 4%. Yet several US majors, such as Southwest, Delta and American, have filed schedules that are flat or even below those in 2024. So too have European mainline operators such as Lufthansa or British Airways. Other carriers are in more expansive mood, such as Turkish Airlines, Pegasus or LATAM Brasil, all showing bullish double-digit growth.

    Source: Cirium Core

    The number of seats offered, in turn, provides a reasonable proxy for the passengers flown. Load factors – the percentage of seats filled – tend to be relatively stable within a percentage point or two, assuming no major external events. It is a key task for airline revenue management teams to keep them so by varying fare levels. Building in other available factors, such as for seasonality, route type and aircraft configuration, will further refine the model.

    Passenger liability

    Answering the second half of the question, around nationality, is more intricate still. Short of studying the manifest, it is not possible to be certain about the number and nationality of travelers on a particular flight on any given day. Here too, there is a growing collection of potentially useful proxies to borrow from the air transport industry, which is itself now engaged in gaining a better understanding of directionality of travel and passenger segmentation.

    One big clue is available from Point of Sale (POS) data collected through the global agency booking channel. The high-density market between Western Europe and North America (USA and Canada) helps illustrate the point. The advance of joint venture services has long-since ended any simple assumptions that flag-carriers predominantly serving their own nationals.

    POS data for 2024 suggests that while the overall market swung toward North America, likely helped by a strong US dollar, carriers from Western Europe carried just over half of all travelers. In other words, European carriers increased their share of US originating traffic.

    Source: Cirium Core

    British Airways, KLM and Lufthansa each had more than 40% of passengers starting their journey on the opposite side of the Atlantic, while Air France posted a small majority. US majors carried higher shares of their own nationals, but still collectively with a third from Europe. Also worth noting that 4% of passengers came from other world regions.

    Admittedly the data is not perfect. The location from where a ticket is purchased does not necessarily confirm the nationality of the buyer. Agencies, especially online, may channel ticketing through a central regional hub, masking the true location of the booker. The data is also only a sample, albeit a large one. At an aggregate level, though, it provides a fairly consistent regional picture, and the data is only getting better.

    Other sources of location data, including from consumer search and spend, look promising in providing deeper clues, not only to point of origin, but also to the demographic of the traveler, often otherwise limited to cabin class and booking source.

    A smart combination of both network analytics and point-of-origin could perhaps finally begin to add some deeper colour in answering that simple question over future passenger numbers and nationality.

    This article was originally published in Cirium’s Aviation Data in Insurance report. For more insights and analysis into the evolving role of data in aviation insurance, read the full report.

  • A Marathon Mindset: The 2025-2034 Cirium Helicopter Forecast

    Sara Dhariwal, Senior Aviation Analyst, Lead Appraiser – Helicopters & AAM, Cirium Ascend Consultancy

    The past decade has for the helicopter industry been largely lived through a downturn. A prolonged period of significantly reduced oil prices affected production and exploration, which impacted the offshore support market. This turned relative undersupply to oversupply at a rapid speed leaving a substantial pool of excess helicopters, resulting in notable pressure on values. Growth slowed from a CAGR of around 2.5% prior to 2015, to 1.2% in the most recent decade. 

    In 2024 there was a fleet growth of 1.9% which is the strongest since 2015 signalling ongoing recovery.

    The growth has been supported by stable deliveries, and lower attrition – with fewer retirements and total losses. In 2024, there were almost 100 fewer retirement/total loss events than in 2023. This means that existing fleet is being used longer supporting the long useful lives of helicopters, which helps strengthening investment cases. It also marks a welcome and long-term improvement in terms of safety.

    Over the next 10-year period, the 2025 Cirium Helicopter Forecast anticipates a continued steady rebound at a pace of 1.3% year-on-year. The market is expected to welcome 7,500 new civil turbine helicopters, reaching a fleet of 27,700 by 2034. Key drivers will be the need for replacements and rising demand in emerging markets.

    Helicopter delivery forecast (2025-2034)

    Despite recovery from the oil and gas downturn and the Covid-19 pandemic, the 2025 forecast is 3% lower than 2024 due to ongoing supply chain constraints making lead times for new aircraft extensive. Annual deliveries dropped to 512 in 2020 but rebounded to nearly 700 in 2023, with no growth in 2024. A 5% decline is expected in 2025 compared to 2024, with gradual recovery projected and reaching 2014 levels (~790 units) by the early 2030s.

    Overall, the forecast anticipates –

    • 7,500 new civil turbine helicopters valued at $50 billion in 2025$ (based on a Base Full-Life Value for a typical utility machine) to be delivered over the next decade.
    • 54% of demand is expected to be driven by replacement, and 46% by fleet growth.

    Forecast annual civil helicopter deliveries 2025-2034

    Source: 2025 Cirium Helicopter Forecast

    Key factors stimulating future helicopter demand include:

    • Aging fleets, especially in North America and Europe.
    • Recovery in offshore oil support and growth in Asia-Pacific.
    • Introduction of new models (e.g., H140, R88, Bell 525).

    In 2024, there were 225 helicopters recorded as retired which was 100 fewer than 2023 and likely a result of a combination of high demand and constrained supply, as OEMs find challenges in despatching new helicopters due to ongoing supply chain issues. Subsequently and whilst deliveries are not predicted to increase significantly in the near term due to the challenges, it leads to longer use of the existing fleet.

    Longer use underpins the asset class having strong residual values, supporting investment.

    Helicopter replacement demand

    Over the last 10 years, Cirium recorded approximately 2,200 permanent retirements, averaging around 1% of the fleet annually. This retirement rate is relatively low compared to commercial fixed-wing aircraft standards.

    The average age of retirement in the past 10 years has been at 37.5 years.

    Besides the physical retirements, there is also attrition from the fleet through accidents (total losses), which has to be factored into replacement demand and can be added to retirements.

    Cirium Ascend monitors the total losses for helicopters and some 1,200 were recorded in the past 10 years. As helicopters operate in many different roles and environments, their loss rate can be comparatively high versus other commercial aviation sectors.

    On a per year basis, some 1% of the fleet was being lost 20 years ago, but the trend has been declining and has been at just 0.5% in the most recent ten-year period. In 2024, the recorded rate was a record low of only 0.4%. This effectively means there is replacement demand for an average of 1.4% of the fleet annually, or 4,050 civil turbine helicopters in the next 10 years, which is 17% of the current total fleet.

    Helicopter fleet growth outlook

    Forecast civil helicopter fleet to 2034

    Source: 2025 Cirium Helicopter Forecast

    By 2034, the global fleet is projected to reach 27,700 helicopters, growing at a slow but steady 1.3% annually, slightly higher than the previous decade’s rate.

    North America is projected to remain the largest market, followed by Europe. The projection for Asia-Pacific has been revised in the 2025 forecast due to growth slowing down in recent years following restriction on airspace usage in China, impacting demand for helicopters.

    Slow but steady seems a good pace for the helicopter market. The pre-2014 sprint approach to secure quick returns failed. Few held on to those returns as the oil and gas downturn led to financial hardship across the industry.

    Some would argue that slow and steady is “boring” and implies that there isn’t anything of interest going on in the market. The stronger argument is possibly that slow and steady provides companies the time required to make better, more considered long-term strategic decisions.

    The past decade suggests that discipline, and resilience alongside consistency, pacing, and the ability to learn from experience and adapt to unexpected situations is key. In other words, a Marathon Mindset, rather than that of a sprint.


    REQUEST THE FULL 2025-2034 CIRIUM HELICOPTER FORECAST HERE

  • Rob Morris: Reflecting on a 35-year career in aviation

    When Rob Morris checks out from Cirium Ascend Consultancy‘s London Heathrow headquarters at the end of August, he will be calling time on a 35-year career in which he has gone from British Aerospace market analyst to influential voice that resonates across the ever-changing global aviation industry.

    As will be familiar to many in the industry, the spark of that career began in childhood, says Morris, recalling that he received a pair of binoculars one year for Christmas and headed down with his brother to Heathrow to try them out.

    “We spent a day watching the planes, and my passion for aviation was born just looking at those planes.”

    That spark ignited something, but Morris admits he was “a fairly naive teenager, not knowing what I really wanted to do”, so settled on studying chemistry, which led to a job with the United Kingdom Atomic Energy Authority in the 1980s.

    The shift into aviation would not come until 1989 when he applied for a database analyst position at British Aerospace, but the role was already filled. However, as a market analyst had just left the company, Morris was invited back to interview for that role. This resulted in a career change at age 27, to start work at BAe in Hatfield.

    “And I still remember sitting there in May 1990, my first day in Hatfield thinking: ‘Am I getting paid to do this? That’s robbery!’”

    He primarily worked on BAe’s Worfleet database, with the task of running queries of fleet data and at times the ABC Schedules database – a grounding for his later role leading consultancy at Cirium.

    “Everything our team says now is based upon a reading of the data and interpretation of the data, the trend of the data, that kind of thing. So having been privileged enough to work with Cirium and being able to go and present that data to the world has been an end of my career that I could never have imagined.”

    Back in the early 1990s, as a 27-year-old new entrant to the business, Morris quickly immersed himself into the industry and its dynamics, largely through attending conferences.

    “I sat and listened to what people were saying, and I vividly remember my first finance conference in Geneva around 1991 where I sat there and thought: ‘What are they talking about? I need to go and learn about this,’” he recalls.

    As that was occurring, though, BAe itself was transitioning from OEM to supplier and later to defence contractor BAE Systems.

    For Morris, this meant that instead of having “a job for life”, within a few years he would have to make a career move as the manufacturer moved production away from its Hatfield site.

    That led to a role with the UK’s Department of Trade and Industry, which included a lot of time working with Airbus, which was just starting to overtake McDonnell Douglas as the second-largest airframer in the world.

    From there, he joined BAE Systems Asset Management – the forerunner to Falko – before joining Ascend in January 2012, not long after the business had been acquired by the parent of what is now Cirium.

    “I thought I’d just be a senior consultant, but then in 2014 came the chance to lead the business, and together with our Head of Valuations George Dimitroff, we became the leaders of Ascend.”

    Leading an award-winning team

    That ascendancy came as Cirium, under previous branding, was in its own transition from publisher to aviation data provider through several acquisitions, which expanded the consultancy team’s available toolbox considerably, and allowed Morris and the team to focus on delivering data-driven insights, which has continued to grow.

    “We had fleets data and we had values and lease rates. Then we got the schedules and then latterly we got tracking, [which] is just fabulous because tracking tells us what’s happening in real time or in near-real time.”

    Asked about his professional highlights, Morris points to Cirium Ascend Consultancy’s ten wins of the Airline Economics Appraiser of the Year award.

    “Appraiser of the Year is the only way the market can recognise us publicly other than giving us their business, so winning that, keeping the confidence of the team in the market has been really important for us,” he says.

    Another key achievement has been building up the skills of the consultancy team, including adding more ISTAT- and ASA-certified appraisers.

    “Developing the team has become probably the thing I’m proudest of at the end of my career, just being able to try and help to mentor more junior members of the team,” he says. “And that’s what I’m going to miss the most: working with those people day to day. But of course, with global connectivity, I’ll still be able to connect with those people most days. So I’ll be watching closely to see the industry continue.”

    Constants and change

    Over Morris’s 35-year career he has witnessed some major changes in the market, including tracking closely the rise of Airbus into its current duopoly with Boeing in the large-jet market.

    “I’ve never stopped learning,” he reflects. “Every day this industry teaches you something new, and that’s why it’s so fascinating and why it’s such an exciting industry. Because it’s only with 35 years’ hindsight can you see the big changes that have happened, but each day you don’t really see them.”

    Another big change Morris notes is the rise of operating leasing, which now finances just over half of new deliveries – a far cry from where it was when he started in the industry.

    “Back in 1990, leasing was hardly a thing, and I’m sure most of the financing was either sovereign debt or bank debt. Now you have these financial institutions that are more effective at raising capital than airlines which can manage the asset for financial gain.”

    He also bore witness to some key shocks, most notably 9/11 and the Covid pandemic.

    Of the post-9/11 crisis, Morris, who was then working at the Department of Trade and Industry, recalls: “It was the first time in my career that things were changing daily, and we were trying to understand how they were changing.”

    But the Covid pandemic and the rapid recovery of demand thereafter, which has led to major disruption of the supply chain across the industry, gave rise to a whole new scenario.

    “We’ve come out of it far more quickly than we expected to, and the OEMs and their suppliers have been caught on the hop. Supply is lagging demand, and we can hypothesise about how much, and where the equilibrium is, et cetera, but it is a fact that it is lagging, new aircraft supplies lagging demand, and that’s a big issue.”

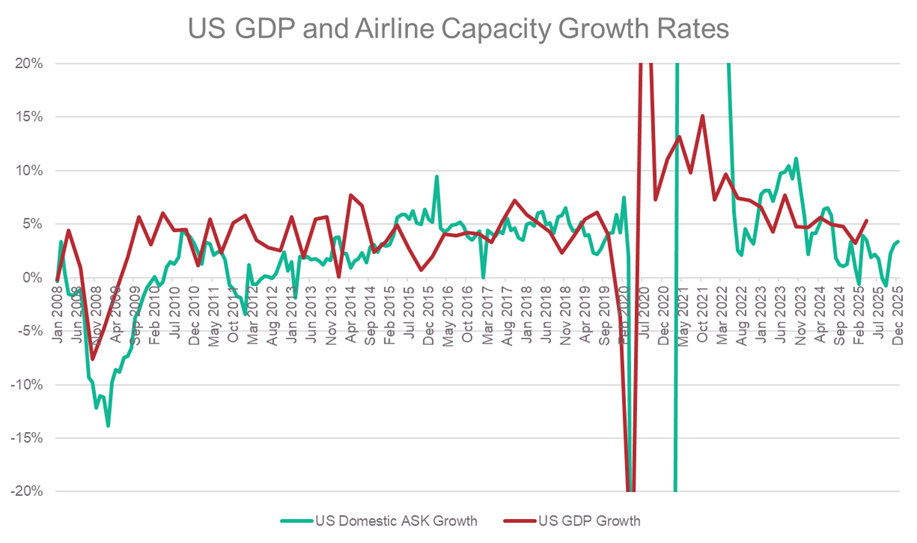
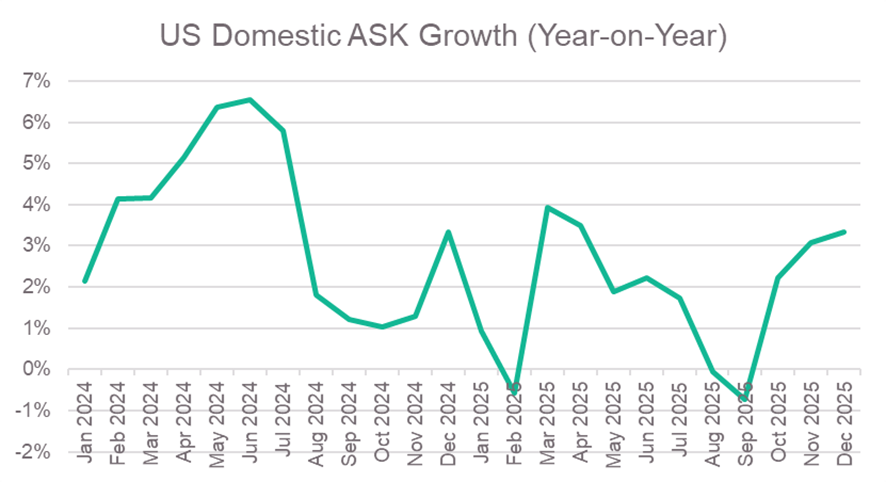
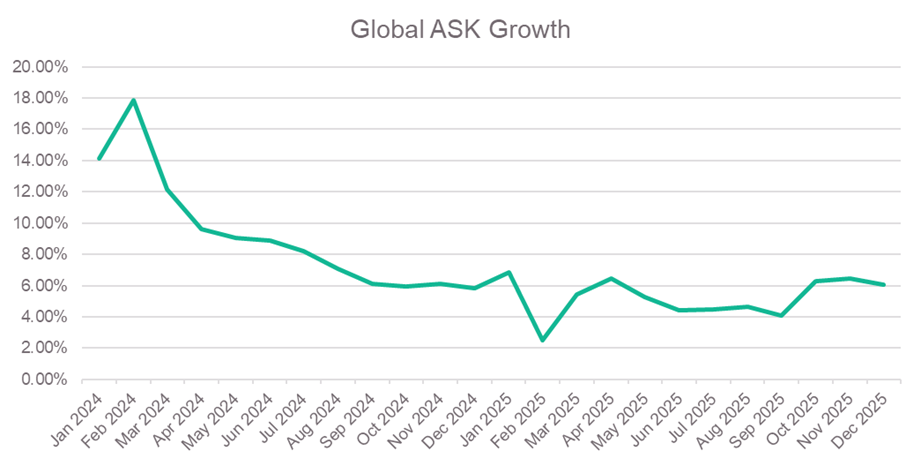
    In the same breath, though, Morris notes that traffic demand is slowing this year, and that growth is forecast at around 5% instead of the 8% predicted at the start of the year.

    That leads him to another insight: “I’ve always said in the periods when we’ve got growth, my job is to say ‘Calm down’ and in the periods when we’ve got decline, my job is to say: ‘It’s fine, it’ll be OK. Cheer up, don’t get caught up in the moment because we’ve got a long-term growth industry.’

    “I’m probably a pragmatist, but I’m an optimist by nature of the industry because of those underlying fundamentals that are strong.”

    He also points out that for all that has changed, the fundamentals of aircraft design have not.

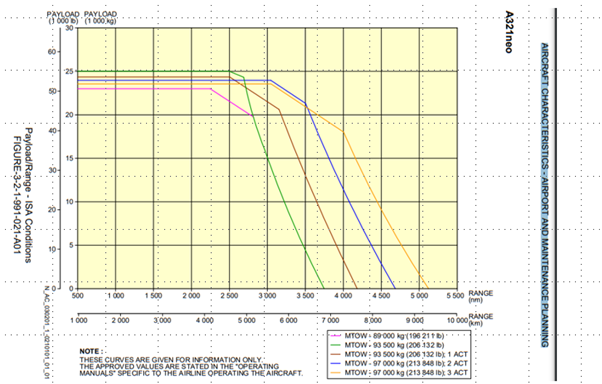
    “When I think about the aircraft that we were delivering in 1990, like the A320 which today has had new engines and a slightly different wing, the geometry is still a cigar tube with wings on it.

    “And the 787 looks very similar to the 767 that was being delivered in 1990 – OK, with different materials – but similar geometry. So the efficiencies have been more incremental than fundamental.”

    What next?

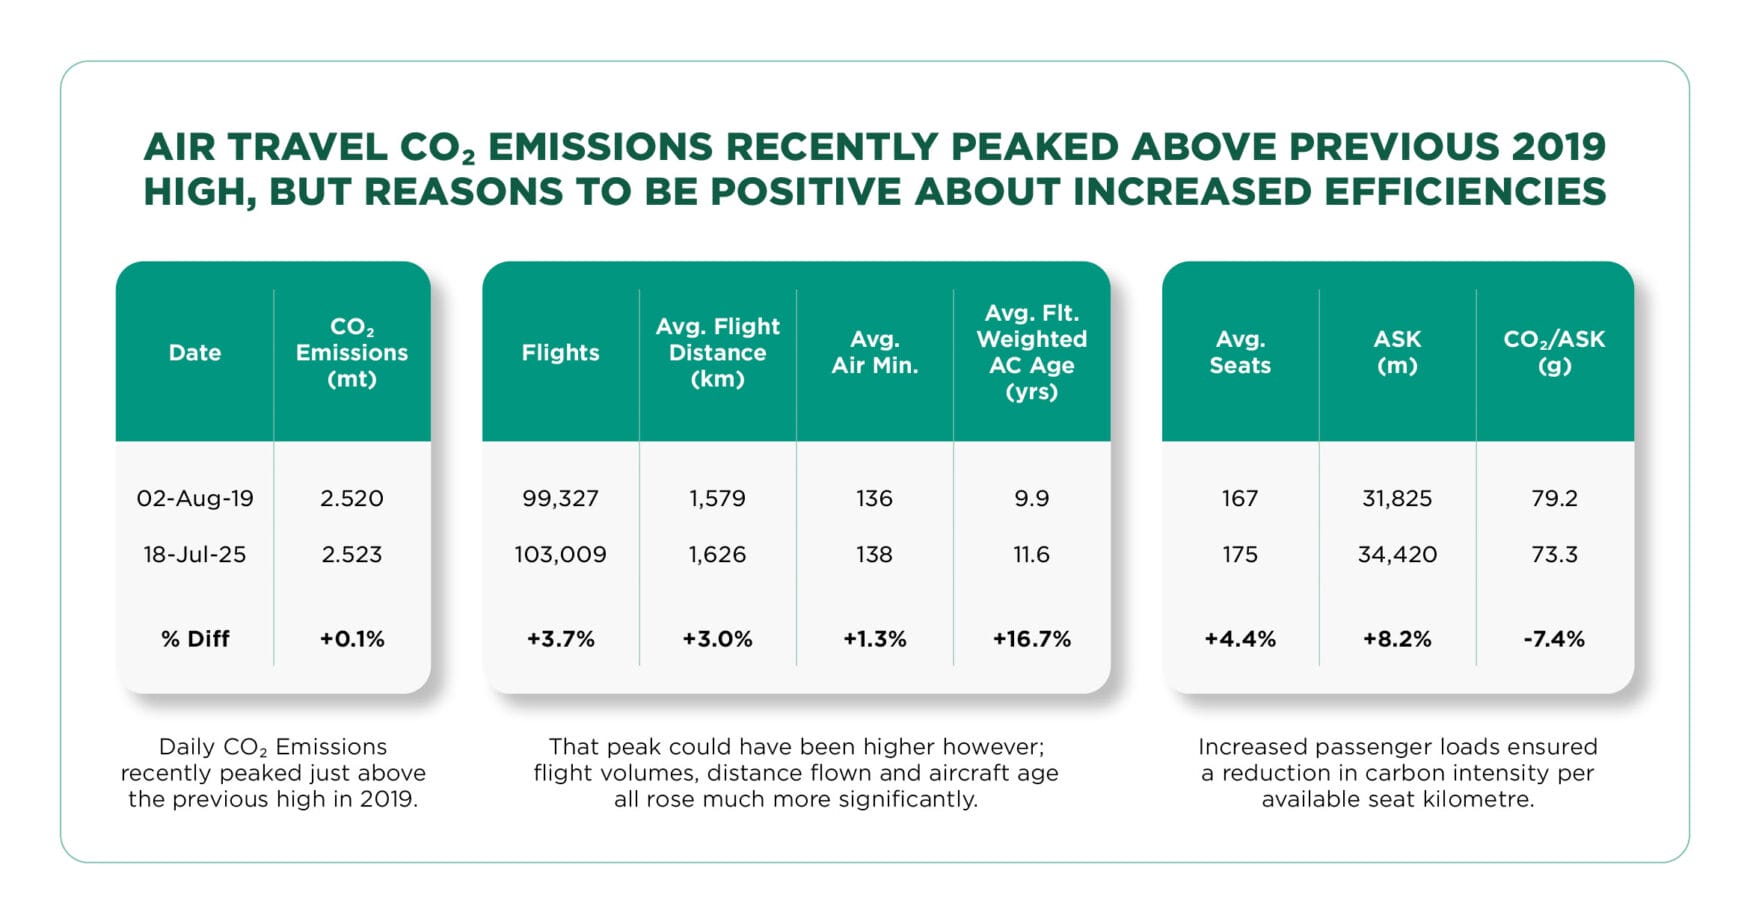
    Morris warns that this poses a problem for the industry as it may hold back the kind of progress on emissions that will make it a larger target for politicians to take action against to constrain its growth.

    “If we don’t do enough, then regulators will do more. They’ll say if the only way to decarbonise aviation is to make flying less attractive, and the way to make flying less attractive is to make flying more expensive.

    “If we, if the businesses don’t deal with it, then eventually the regulators will deal with it. Now it might be too late for the planet by then, but they’ll still deal with it.”

    More positively, as a long-time data watcher, Morris is curious about how artificial intelligence will play a greater role in decision making for the industry.

    “I’m kind of getting out at a strange time because I’m getting out at a time when all these things are changing, but actually the point is that as you get older, change becomes harder to manage and deal with.

    “You know, doing things in a certain way becomes not comfortable, but it becomes what you do and it’s harder to exit your comfort zone at 60-something than it is at 20-something.”

    More immediately, though, Morris says he has not given much thought to his next move after leaving Cirium.

    “I do know that my garden needs a lot of work. I do know that I need to spend more time with my family and I do know that I want to spend more time watching my football team, Reading.”

    He muses that he may write a book about the club; and travel is also high on the list of priorities, although more of that may be on the ground given how often work has taken him around the world over several years.

    “I don’t want to get on aeroplanes quite so much,” he admits.

  • The Hidden Costs of Aircraft Aging

    Andrew Doyle
    Andrew Doyle

    Andrew Doyle, Senior Director of Strategy, Cirium


    In the complex world of aviation, aircraft maintenance is a critical aspect of airline operations. A recent case study conducted by Cirium’s Andrew Doyle, Senior Director Strategy, reveals surprising insights into how aircraft age impacts maintenance duration and efficiency, potentially costing airlines significant time and money.

    The Data Behind the Findings

    The analysis focused on an unnamed airline (referred to as “Airline X”) and its fleet, examining maintenance events over a 12-month period. Key observations emerged from a comprehensive review of maintenance, repair, and overhaul (MRO) providers’ performance using Cirium’s data capabilities.

    Maintenance Providers and Performance

    The study tracked 30 maintenance events across different MRO providers:

    • 4 events handled by the airline’s in-house MRO division
    • 4 external MRO providers performed the remaining maintenance

    What became immediately apparent was the significant variation in ground time across different maintenance providers. Two MROs stood out:

    • MRO A: Two checks overran by over 30 days, resulting in 75 lost operational days
    • MRO D: 9 checks averaged 5.5 days longer than expected, causing nearly 50 lost days

    The Age Factor: A Critical Correlation

    Perhaps the most intriguing finding from the data was the correlation between aircraft age and maintenance duration.

    • Aircraft 6-12 years old: Shortest ground times
    • Aircraft 12-18 years old: Significant increase in maintenance duration (up to 32 days longer)
    • Aircraft 18-24 years old: Slight reduction in ground time
    • Aircraft over 24 years: Another substantial increase in maintenance duration

    As aircraft age, they typically require more extensive maintenance. Components wear down, technological obsolescence becomes a factor, and the complexity of repairs increases. This translates directly into longer ground times and higher operational costs.

    The Value of Data-Driven Insights

    For the first time, airlines and MRO providers can compare maintenance performance across global providers, understand the direct impact of aircraft age on maintenance efficiency and make more informed decisions about fleet management and maintenance strategies.

    The analysis provides unprecedented visibility into maintenance performance, offering a global benchmark for comparing MRO provider efficiency, insights into the true cost of an aging fleet and potential strategies for optimizing maintenance scheduling.

    Aircraft maintenance is more than just a routine check – it’s a complex ecosystem where age, provider efficiency, and operational strategy intersect. As airlines continue to seek ways to optimize their operations, understanding these nuanced relationships becomes increasingly crucial.

  • How High-Speed Rail is Reshaping Chinese Regional Air Travel

    Cirium Ascend Consultancy is trusted by clients across the aviation industry to provide accurate, timely, and insightful aircraft appraisals. The team provides the valuations and analysis the industry relies on to understand the market outlook, evaluate risks and identify opportunities.

    Discover the team’s industry reports & market commentaries. Read their latest expert analysis, viewpoints and updates on Thought Cloud.

    Scott Zhao
    Scott Zhao

    Scott Zhao, Principal Aviation Analyst, Cirium Ascend Consultancy

    China’s transportation landscape has undergone a quiet but profound transformation, one that is redefining how people move across the country and recalibrating the roles of air and rail in the national mobility ecosystem. At the heart of this shift is the rapid rise of high-speed rail (HSR), which has not only captured market share from short-haul aviation but has fundamentally altered traveller behaviour, airline network strategies, and urban connectivity.

    With a series of strategic milestones, from the 2007 railway speed-up, when several existing lines were upgraded to support operations at speeds of up to 250 km/h, to the 2017 launch of the 350 km/h “Fuxing” trains, China has built one of the world’s most advanced HSR network, one that now outperforms air travel on many regional routes.

    For urban travellers in China, the total time from home departure to passing security at the terminal is a critical factor in mode choice. Despite the speed of air travel, the full door-to-security journey often favours high-speed rail, especially for trips under 800 km. This analysis compares average total travel times from a typical urban centre residence to completing security at major airports versus high-speed rail stations across China’s first-, second-, and third-tier cities. This advantage is evident across city tiers.

    Average total time – home door to security clearance:

    City tierAirport (door to security)HSR station (door to security)Time saved by HSR
    First-tier (e.g., Beijing, Shanghai)120 min75 min45 min
    Second-tier (e.g., Chengdu, Hangzhou)105 min65 min40 min
    Third-tier (e.g., Nanchang, Luoyang)85 min50 min35 min

    Note: averages based on typical urban residential areas, non-peak traffic, and standard security wait times

    The time savings stem from three key factors: HSR stations are typically 10–15 km from city centres, compared to 25–40 km for airports; access is faster and less prone to congestion; and security screening is more efficient, with shorter queues and less stringent protocols.

    Time breakdown by component (typical first-tier city):

    StepAirportHSR station
    Home preparation & departure15 min10 min
    Distance to terminal25–30 km10–15 km
    Travel time (car/taxi)55 min30 min
    Parking / entry / walk-in15 min10 min
    Security screening & queue35 min18 min
    Total~120 min~75 min

    Data source: urban mobility surveys, traffic analytics (2023–2024), and operational benchmarks from major Chinese transport hubs

    These advantages explain HSR’s dominance for trips under 800 km, where it offers faster, more reliable, and more convenient service than air, even when flight time is shorter.

    The impact on aviation is clear. As HSR expanded, short-haul flights began to decline in relative importance. The data from Cirium SRS Analyser illustrates a structural shift in domestic air travel patterns:

       Count of total flightsAvg. distance kmFlight count (≤800 km)Flights ≤800 km (as a % of total)Avg. distance (≤800 km flights)
    2011 Q1395681147710454926.4%550
    2013 Q1469721153911836325.2%561
    2015 Q1562112156313035923.2%556
    2017 Q1689640153715202222.0%549
    2019 Q1828744151417544221.2%557
    2024 Q1967186160515781916.3%583
    2025 Q1960944161015267515.9%581

    Data source: Cirium SRS Analyser, all figures refer to scheduled flights only

    While total flight volume has more than doubled since 2011, growth has plateaued in recent years, with a slight dip observed in Q1 2025 suggesting market saturation. More significantly, the average flight distance has increased from 1,477 km to 1,610 km, while the share of short-haul flights (≤800 km) has declined sharply from 26.4% to 15.9%. This shift is not incidental; it reflects the growing impact of HSR on route-level demand. As high-speed rail has expanded and gained preference for sub-800 km journeys, airlines have responded by reallocating capacity toward medium- and long-haul segments, where air travel retains a competitive edge.

    Rather than eliminating demand for air travel, HSR appears to be reshaping it. The above data suggests that airlines may be gradually shifting their focus away from saturated short-haul routes – particularly in regions where HSR provides strong competition – and toward longer domestic flights, international services, and markets where high-speed rail coverage remains limited. These may include parts of western China, smaller cities, or corridors requiring multi-stop connectivity. While further analysis is needed to confirm the extent of this realignment, the observed trends point to a broader strategic adaptation by airlines in response to evolving competitive dynamics.

    The implications for fleet demand are therefore complex. While HSR appears to have suppressed growth in the short-haul segment, this does not necessarily equate to an overall reduction in aircraft needs. Instead, demand may be shifting toward aircraft better suited for longer distances. Cirium’s forecast of over 6,600 new single-aisle aircraft in the next 20 years is driven not just by fleet renewal, but by structural changes in route design and demand profiles, especially as more airlines prioritize efficiency and range in their future operations.

    China’s evolving air network illustrates how modal competition can catalyse innovation and resilience. The rise of HSR has challenged airlines to redefine their role, moving from head-to-head competition to strategic differentiation. The future of mobility in China may not be rail versus air, but rail and air functioning in a more integrated ecosystem. HSR delivers strong regional and intercity access, while aviation continues to lead in long-haul and international connectivity. Together, these modes have the potential to support a more balanced, sustainable, and passenger-oriented transportation system.

    For policymakers and industry leaders, a key takeaway is that high-speed rail need not be viewed solely as a competitor to aviation, but as a potential enabler of broader transport efficiency. By exploring multimodal integration through coordinated scheduling, ticketing, and infrastructure planning, China may be developing a model that reduces redundancy, enhances connectivity, and improves system resilience. Its evolving experience offers valuable insights for other countries planning or expanding high-speed rail networks.

    It is important to note, however, that this analysis has limitations. The time comparisons in Tables 1 and 2 are based on generalized assumptions for typical urban travellers under non-peak conditions. Moreover, the 800-km threshold, though widely used in industry and media, should be interpreted as a flexible benchmark rather than a fixed cutoff. Future research could extend this analysis to routes in the 800–1,000 km range to better understand the full extent of modal overlap and passenger preference shifts as HSR networks continue to evolve.

  • Airport Ground Accumulation Data: A Case Study

    Dr. David Price, Senior Data Analyst, Cirium

    Profiling Aircraft on the Ground

    Understanding the global spatial distribution of the aviation fleet is understandably complex and challenging. Aircraft move quickly, and in most cases, a stationary aircraft is a costly one. One thing is certain: planes do not stay in one place for long.

    So, how do we begin to develop an intuitive understanding of the fleet’s location? A good starting point is to focus on specific locations and, rather than concentrating on individual aircraft, consider the average profile of aircraft grounded there. What does the distribution of aircraft on the ground look like throughout a typical day? How quickly does this change in response to external events?

    The first and most crucial step is to connect the arrival flight with its corresponding departure flight for each aircraft visit to the airport in question. The objective is to construct a continuous timeline of each aircraft’s stay at the airport over the course of a day, enabling us to visualize the number of planes on the ground at any given time.

    Hurricane Milton and Orlando International Airport

    Daily accumulation profile: Orlando International Airport (MCO), October 2024

    Using a sample fleet of the Cirium-identified in-service commercial fleet (excluding aircraft in storage and general aviation aircraft), we can analyse the ground accumulation profiles of airports worldwide. Florida’s Orlando International Airport (MCO) is an instructive example.

    During the first week of October 2024, MCO displayed a fairly typical daily pattern of aircraft ground accumulation. The average peak accumulation occurred around 05:00 local time, with 124 aircraft on the ground ahead of the first wave of morning flights, peaking at 153 on October 6th. Conversely, the average minimum accumulation was recorded around 13:00 local time, with an average of 63 aircraft on the ground. This lull follows the morning departures and precedes the arrival of afternoon incoming flights.

    Over the course of a typical day, the number of aircraft on the ground fluctuates by a factor of two. By identifying this pattern for each airport and snapshotting the grounded fleet at key times, it becomes possible to build a comprehensive picture of maximum grounded exposure for fleets throughout the year.

    Changes at MCO, 6th – 18th October 2024

    In early October 2024, Hurricane Milton formed over the Gulf of Mexico and accelerated towards Central Florida. On October 7th, Orlando International Airport announced commercial operations would cease on the 9th.

     
    A significant number of aircraft and almost all widebody jets were moved away from MCO in preparation for the storm. The rhythmic daily profile described above disintegrated as normal commercial operations came to a halt.

    However, a small population of aircraft remained at MCO as it closed during the storm. Approximately 8-10 narrowbody jets stayed at the airport as the hurricane passed through. Despite some minor damage to facilities, the airport reopened to arrivals on the evening of 10th October, and aircraft quickly returned. Full commercial passenger operations resumed the next day and the daily ground accumulation profile returned to normal one day later on the 12th.

    Answering ‘What Ifs’ With Data

    The profiling data for MCO serves as just one example of how Cirium’s Tracked Utilization and Ground Accumulation data capabilities can be leveraged to monitor fleet activity. Many questions can be answered with this data: what aircraft are on the ground right now? Which airports accumulate the highest fleet exposure? What does a worst-case exposure scenario look like at a particular airport?

    Additionally, what proportion of an airline or lessor’s fleet is grounded at any point in time? How do they typically react during anomalous situations? And whose aircraft are on the ground at a given airport right now?

    This article was originally published in Cirium’s Aviation Data in Insurance report. For more insights and analysis into the evolving role of data in aviation insurance, read the full report.

  • South Side Story – Southeast Asian Airlines’ Stalled Growth

    Cirium Ascend Consultancy is trusted by clients across the aviation industry to provide accurate, timely, and insightful aircraft appraisals. The team provides the valuations and analysis the industry relies on to understand the market outlook, evaluate risks and identify opportunities.

    Discover the team’s industry reports & market commentaries. Read their latest expert analysis, viewpoints and updates on Thought Cloud.

    Thomas Kaplan Senior Valuations Analyst, ISTAT Appraiser
    Thomas Kaplan Senior Valuations Analyst, ISTAT Appraiser

    Thomas Kaplan, Senior Valuations Consultant, Cirium Ascend Consultancy

    News that AirAsia had signed for up to 70 A321XLRs earlier this month certainly raised eyebrows. An airline that already has such a large backlog, and which is still emerging from restructuring, should not, on the face of it, be adding more orders. Reading beyond the headlines, however, the 70 A321XLRs are only commitments, not firm orders. AirAsia Group’s firm orderbook stands at 402 aircraft, all A321neos (including 20 XLRs) save for 15 A330neos. Its in-service passenger fleet comprises only 219 aircraft (mostly A320-family jets, plus 24 A330neos), which is still fewer than the 240+ it was operating in 2019.

    In 2015, we prepared a slide deck showing the airlines in Asia-Pacific that had orderbooks far larger than their in-service fleets. Two airlines were outliers: Lion Air and AirAsia. Our message at the time was these airlines had managed double-digit growth rates in the past and it was theoretically possible for them to absorb their orderbooks if they managed to continue the same growth trend.

    There were reasons to be optimistic about Southeast Asia’s air travel market. The 640 million people spread across islands and narrow peninsulas were getting richer and they’d sooner or later take a flight. Tourism was booming, and it seemed Chinese tourists would provide an endless source of demand. The ultra low-cost carrier (ULCC) model applied by AirAsia and Lion Air was seen as the best way to capture and drive that growth.

    Ultimately, the story of fast-paced growth was not to last. Economic and geopolitical factors along with the competitive dynamics of a ULCC turf war all contributed to a decade of slowed growth.

    The chart below shows the compound annual growth rate of the in-service narrowbody passenger jet fleet of Southeast Asian airlines with the largest orderbooks, compared with the region’s overall fleet growth. Looking at five-year periods (but shifting 2020 to 2019 in order to isolate pre-pandemic figures), we can see 2005-2015 was a time of very rapid growth for AirAsia and Lion Air with sustained periods of over 20% annual growth. The Southeast Asian fleet also grew at around 10% per year throughout that decade.

    The period of 2015-2019 brought a marked reduction, to single-digit levels, with AirAsia’s narrowbody fleet growing at the same pace as the rest of the region’s fleets. VietJet, which was Vietnam’s ULCC, tripled in size from 24 to 76 aircraft, but added fewer aircraft than Lion Air did and only slightly more than AirAsia.

    Since 2019, growth has been a struggle for all these players. Over the past six years, the Southeast Asian narrowbody jet fleet actually shrunk at a rate of 1% per year, and the highest ULCC compound annual growth rate was VietJet’s 3%, a far cry from the >20% the region’s high-flyers had achieved in the past.  

    Filters: Narrowbody jets, passenger usage, years calculated as 1 July, company category Airlines. Southeast Asia is defined as: Brunei, Cambodia, East Timor, Indonesia, Laos, Malaysia, Myanmar, Philippines, Singapore, Thailand, Vietnam.
    Source: Cirium Fleets Analyzer

    The stalled growth raises questions about the remaining substantial orderbook. Southeast Asian Airlines have 1,366 narrowbody passenger jets on order, representing 144% of the current in-service fleet. By comparison, the world’s backlog share of in-service narrowbody fleet is only 66%.  Large Southeast Asian ULCCs’ backlog can be 180% to over 300% of their in-service fleets, which are about the same level as they were 10 years ago. The chart below shows this, while omitting the pandemic years in which the temporary parking of aircraft led to a small in-service fleet, artificially inflating orderbook share.

    Filters: Narrowbody jets, passenger usage, years calculated as 1 July, company category Airlines. Southeast Asia is defined as: Brunei, Cambodia, East Timor, Indonesia, Laos, Malaysia, Myanmar, Philippines, Singapore, Thailand, Vietnam.
    Source: Cirium Fleets Analyzer

    Southeast Asian airlines are not taking deliveries fast enough to make a dent in their orderbooks and bring them back to stable levels. Supply chain issues that have been plaguing the industry are partially to blame, but the slowing fleet growth began before the pandemic and the Max grounding. Southeast Asia’s peak for passenger narrowbody jet deliveries was back in 2014 at 126. That is more than has been delivered since the start of 2020.

    A replacement cycle rather than a growth cycle may finally drive deliveries, but there are problems with orders placed so far in the past. AirAsia placed a massive order for 200 A320neos back in 2011. To date, only 55 A320neo family aircraft have been delivered to the group. It may have received a good deal from Airbus at the time, but what does 14+ years of escalation do to delivery pricing? Orders were likely renegotiated during the pandemic as the group also went through general restructuring, but escalation continues to increase the eventual delivery pricing.

    Southeast Asia is not the only place with a very large narrowbody jet orderbook as a share of in-service fleets. India, Saudi Arabia and Hungary (home to Wizz Air) stand out with orderbook shares at over 200%. It can be argued these have growth potential in different ways, but the ULCCs of Southeast Asia appear to have over-ordered given the trend of the last decade.

    This does not risk causing global oversupply, as OEMs cannot deliver fast enough to meet the global demand in any case. However, the backlog increases the risk for those airlines with growing liabilities in terms of escalating delivery pricing in an ultra-competitive market which appears not to be growing as fast as their ambitions.

  • Is Commercial Aviation Cruising or Climbing?

    Commercial aviation faces a complex landscape in 2025, showing clear momentum while facing new challenges that hold the potential to reshape the sector’s trajectory.

    In Commercial aviation in 2025: cruising or climbing?, MUFG’s Head of Aviation Research joined Cirium Ascend Consultancy’s Max Kingsley-Jones and Sofia Zoidou to explore the key factors shaping the industry’s path forward. In a lively and wide-ranging discussion, they shared data, insights and perspectives on commercial aviation’s outlook in the near-term and beyond.

    Tariffs Create Industry-Wide Uncertainty

    Trade tensions dominated much of the discussion, with tariffs emerging as a significant and wide-ranging risk factor. Max Kingsley-Jones emphasized that “tariffs pose a risk to all the parameters, be it demand, supply, and also to aircraft values.” He pointed to slowing demand for cargo already showing in tracking data, with international cargo flights demonstrating a sustained year-on-year decline since mid-May in markets touching North America.

    On the risk to aircraft values, Max explained that new aircraft values are unlikely to increase due to the tariff themselves, as this ‘tax’ is not an intrinsic part of the asset’s value. However, if tariffs cause a reduction in new aircraft deliveries, that will further tighten supply and increase positive pressure on secondary market values and lease rates.

    The ripple effects of tariffs will extend beyond manufacturers. Simon Finn highlighted aviation’s unique vulnerability, noting “it’s difficult to think of another industry that’s more globalised than aviation.” He pointed to how the industry’s interconnectedness leads tariff impacts to cascade throughout the supply chain, forcing manufacturers to determine what is passed onto the customer, and if they can’t, how to absorb the costs themselves.

    Production Recovery Faces Continued Delays

    Despite ongoing efforts to scale production, original equipment manufacturers (OEMs) remain behind their pre-pandemic output levels. The industry continues to grapple with supply chain constraints that have pushed full recovery timelines from 2025 to 2026.

    Current projections show the challenge ahead. Max noted that manufacturers “are still going to be behind in 2025,” compared to their stated targets, with much depending on supply chain. Cirium recently reduced its 2025 delivery projection by 3% as these issues persist, with only 40% of the revised target achieved during the first six months.

    Airbus faces particular scrutiny in meeting delivery targets. The company delivered 232 A320neo family aircraft in the first half of 2025, representing about 38% of the full-year forecast. Engine availability remains a bottleneck, with approximately 40 additional aircraft ready for delivery once their CFM LEAP engines arrive.

    Boeing’s recovery trajectory appears more promising, though both manufacturers must navigate ongoing supply chain complexities that continue to constrain industry-wide production capacity.

    Engine Supply Chain Bottlenecks Persist

    Engine availability has emerged as a critical constraint on aircraft deliveries. CFM’s LEAP engines power a significant portion of new aircraft, but supply limitations have created delivery delays across the industry.

    The data reveals the scope of this challenge: about 40 aircraft remain as “gliders” awaiting their LEAP engines before delivery completion. CFM accounted for 54% of total A320neo family deliveries in the first half of 2025, highlighting both the engine’s market dominance and the bottleneck’s industry-wide impact.

    These engine-related delays contribute to the broader production constraints facing manufacturers as they work to meet airline demand and fulfil existing order backlogs.

    Future Aircraft Development Accelerates Despite Current Challenges

    Looking ahead, the industry shows signs of preparation for the next generation of commercial aircraft. Both manufacturers and suppliers are advancing technologies that will define aviation’s future, even as current production faces constraints.

    Airbus continues developing its next-generation single-aisle aircraft, targeting a launch by 2030 for delivery around 2038. The CFM RISE open-fan engine technology, showcased as a potential powerplant for this program, represents significant advancement in propulsion efficiency.

    Simon expressed optimism about engine technology readiness, stating it’s “fair and reasonable to expect the engine manufacturers to push their technologies and have something ready for the early 2030s.”

    Market dynamics also support future growth. Airbus and Boeing combined net orders in the first half of 2025 exceeded 1,000, approaching the full-year 2024 total of 1,171. This strong order momentum, boosted by 300 orders added in June alone, indicates sustained airline confidence in long-term demand recovery.

    The emergence of new competitors adds another dimension to future market dynamics. Simon suggested China’s political will to produce an indigenous commercial aircraft may see Comac emerge as a major manufacturer in the long term. He pointed to favourable historic parallels with Airbus’s emergence, but cautioned this may take a decade or more to materialize. “Comac is in a powerful position, but there’s a lot of work to do”.

    Watch the Webinar on Demand

    To access the full presentation, including analysis of the capacity and emission trends, the Paris Air Show and more, register to watch the webinar.