


Dr. David Price, Senior Data Analyst, Cirium
Profiling Aircraft on the Ground
Understanding the global spatial distribution of the aviation fleet is understandably complex and challenging. Aircraft move quickly, and in most cases, a stationary aircraft is a costly one. One thing is certain: planes do not stay in one place for long.
So, how do we begin to develop an intuitive understanding of the fleet’s location? A good starting point is to focus on specific locations and, rather than concentrating on individual aircraft, consider the average profile of aircraft grounded there. What does the distribution of aircraft on the ground look like throughout a typical day? How quickly does this change in response to external events?
The first and most crucial step is to connect the arrival flight with its corresponding departure flight for each aircraft visit to the airport in question. The objective is to construct a continuous timeline of each aircraft’s stay at the airport over the course of a day, enabling us to visualize the number of planes on the ground at any given time.
Hurricane Milton and Orlando International Airport
Daily accumulation profile: Orlando International Airport (MCO), October 2024
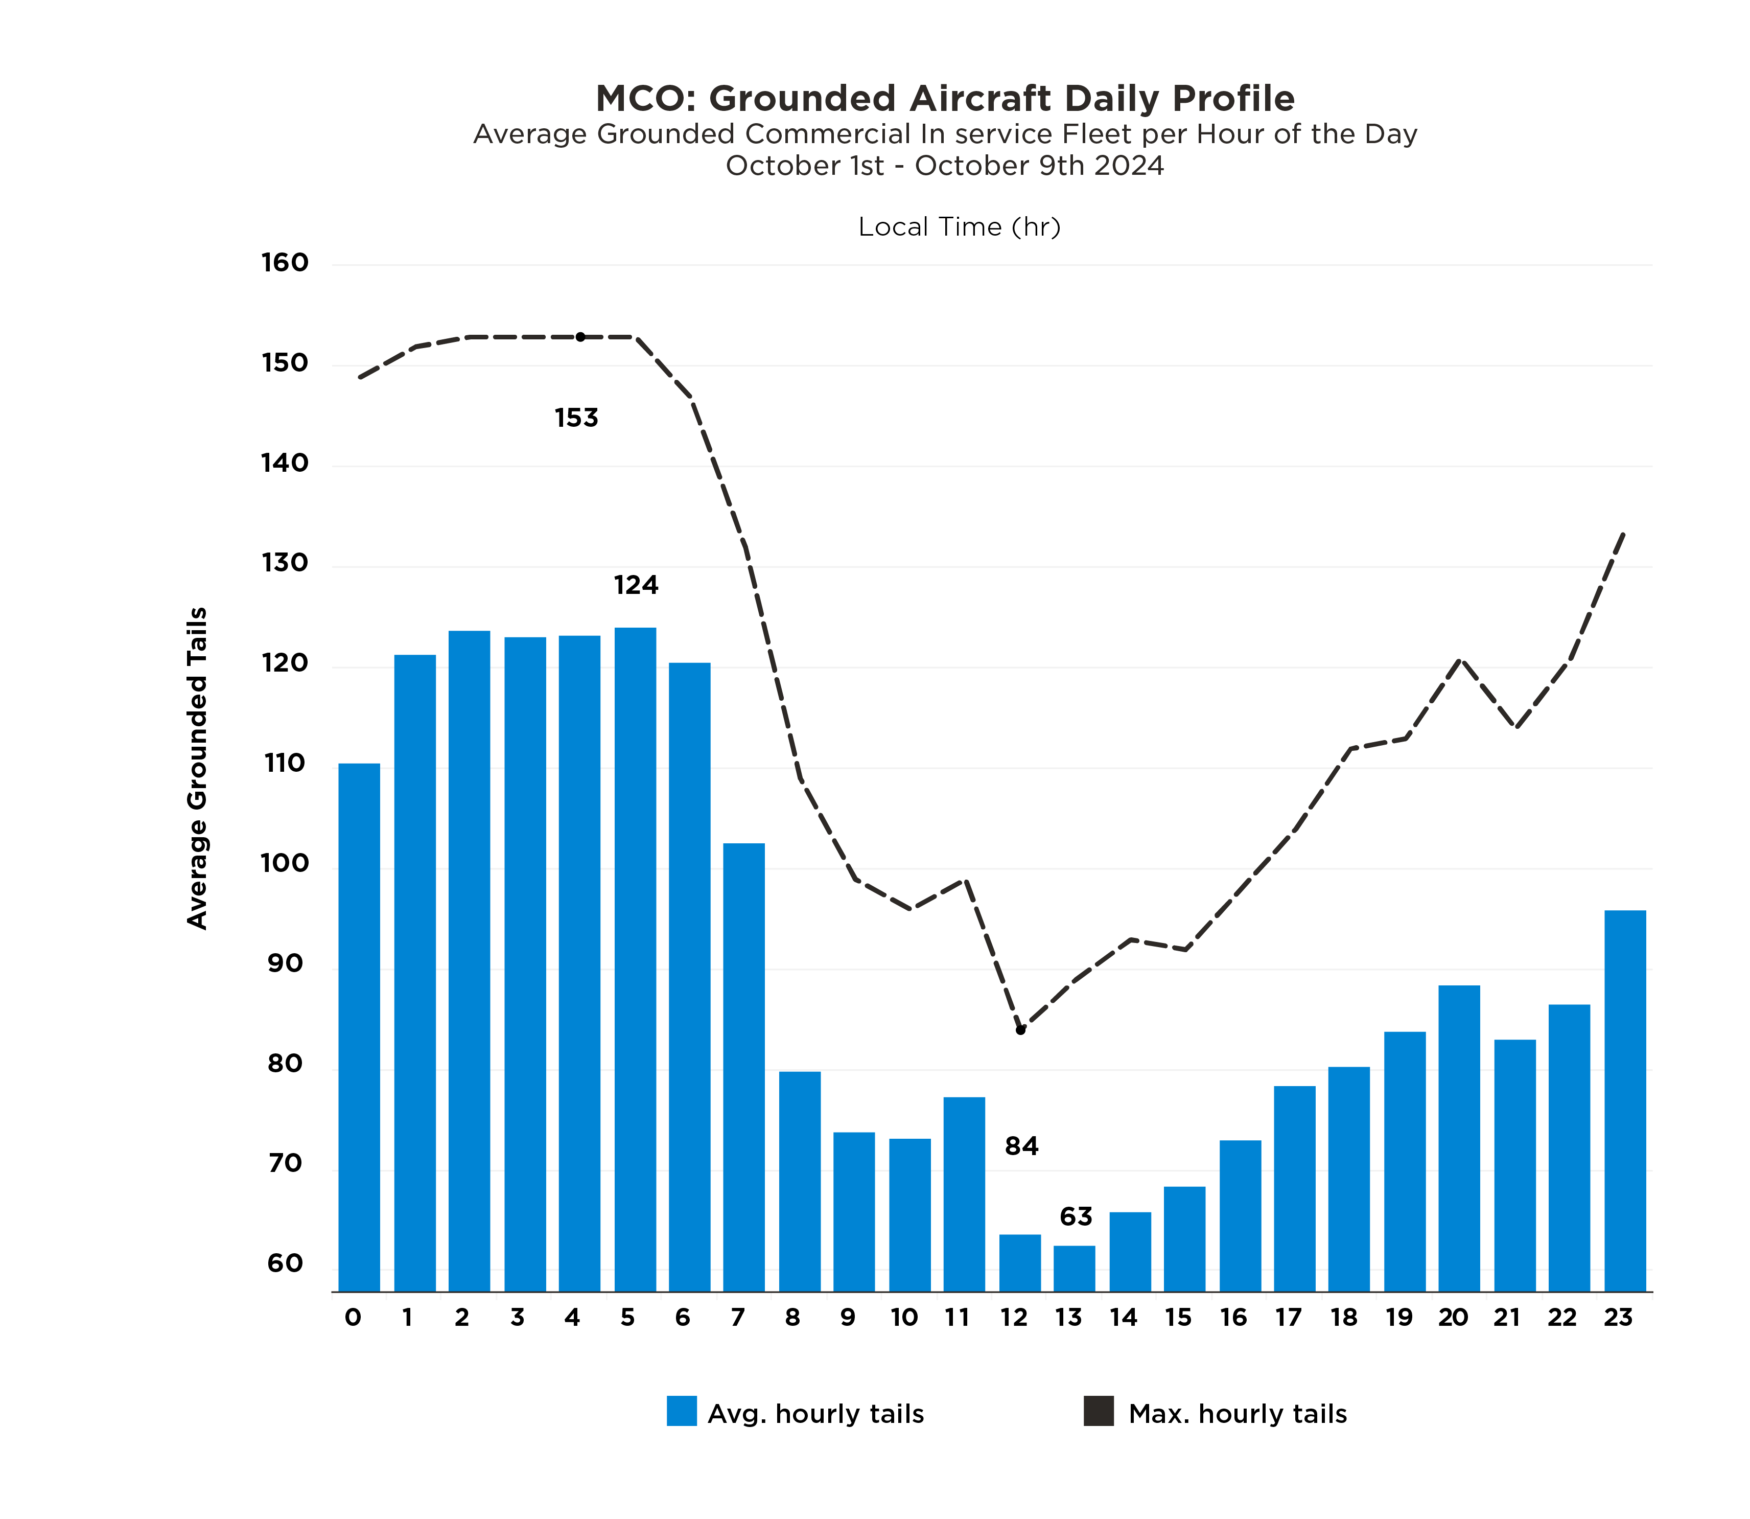
Using a sample fleet of the Cirium-identified in-service commercial fleet (excluding aircraft in storage and general aviation aircraft), we can analyse the ground accumulation profiles of airports worldwide. Florida’s Orlando International Airport (MCO) is an instructive example.
During the first week of October 2024, MCO displayed a fairly typical daily pattern of aircraft ground accumulation. The average peak accumulation occurred around 05:00 local time, with 124 aircraft on the ground ahead of the first wave of morning flights, peaking at 153 on October 6th. Conversely, the average minimum accumulation was recorded around 13:00 local time, with an average of 63 aircraft on the ground. This lull follows the morning departures and precedes the arrival of afternoon incoming flights.
Over the course of a typical day, the number of aircraft on the ground fluctuates by a factor of two. By identifying this pattern for each airport and snapshotting the grounded fleet at key times, it becomes possible to build a comprehensive picture of maximum grounded exposure for fleets throughout the year.
Changes at MCO, 6th – 18th October 2024
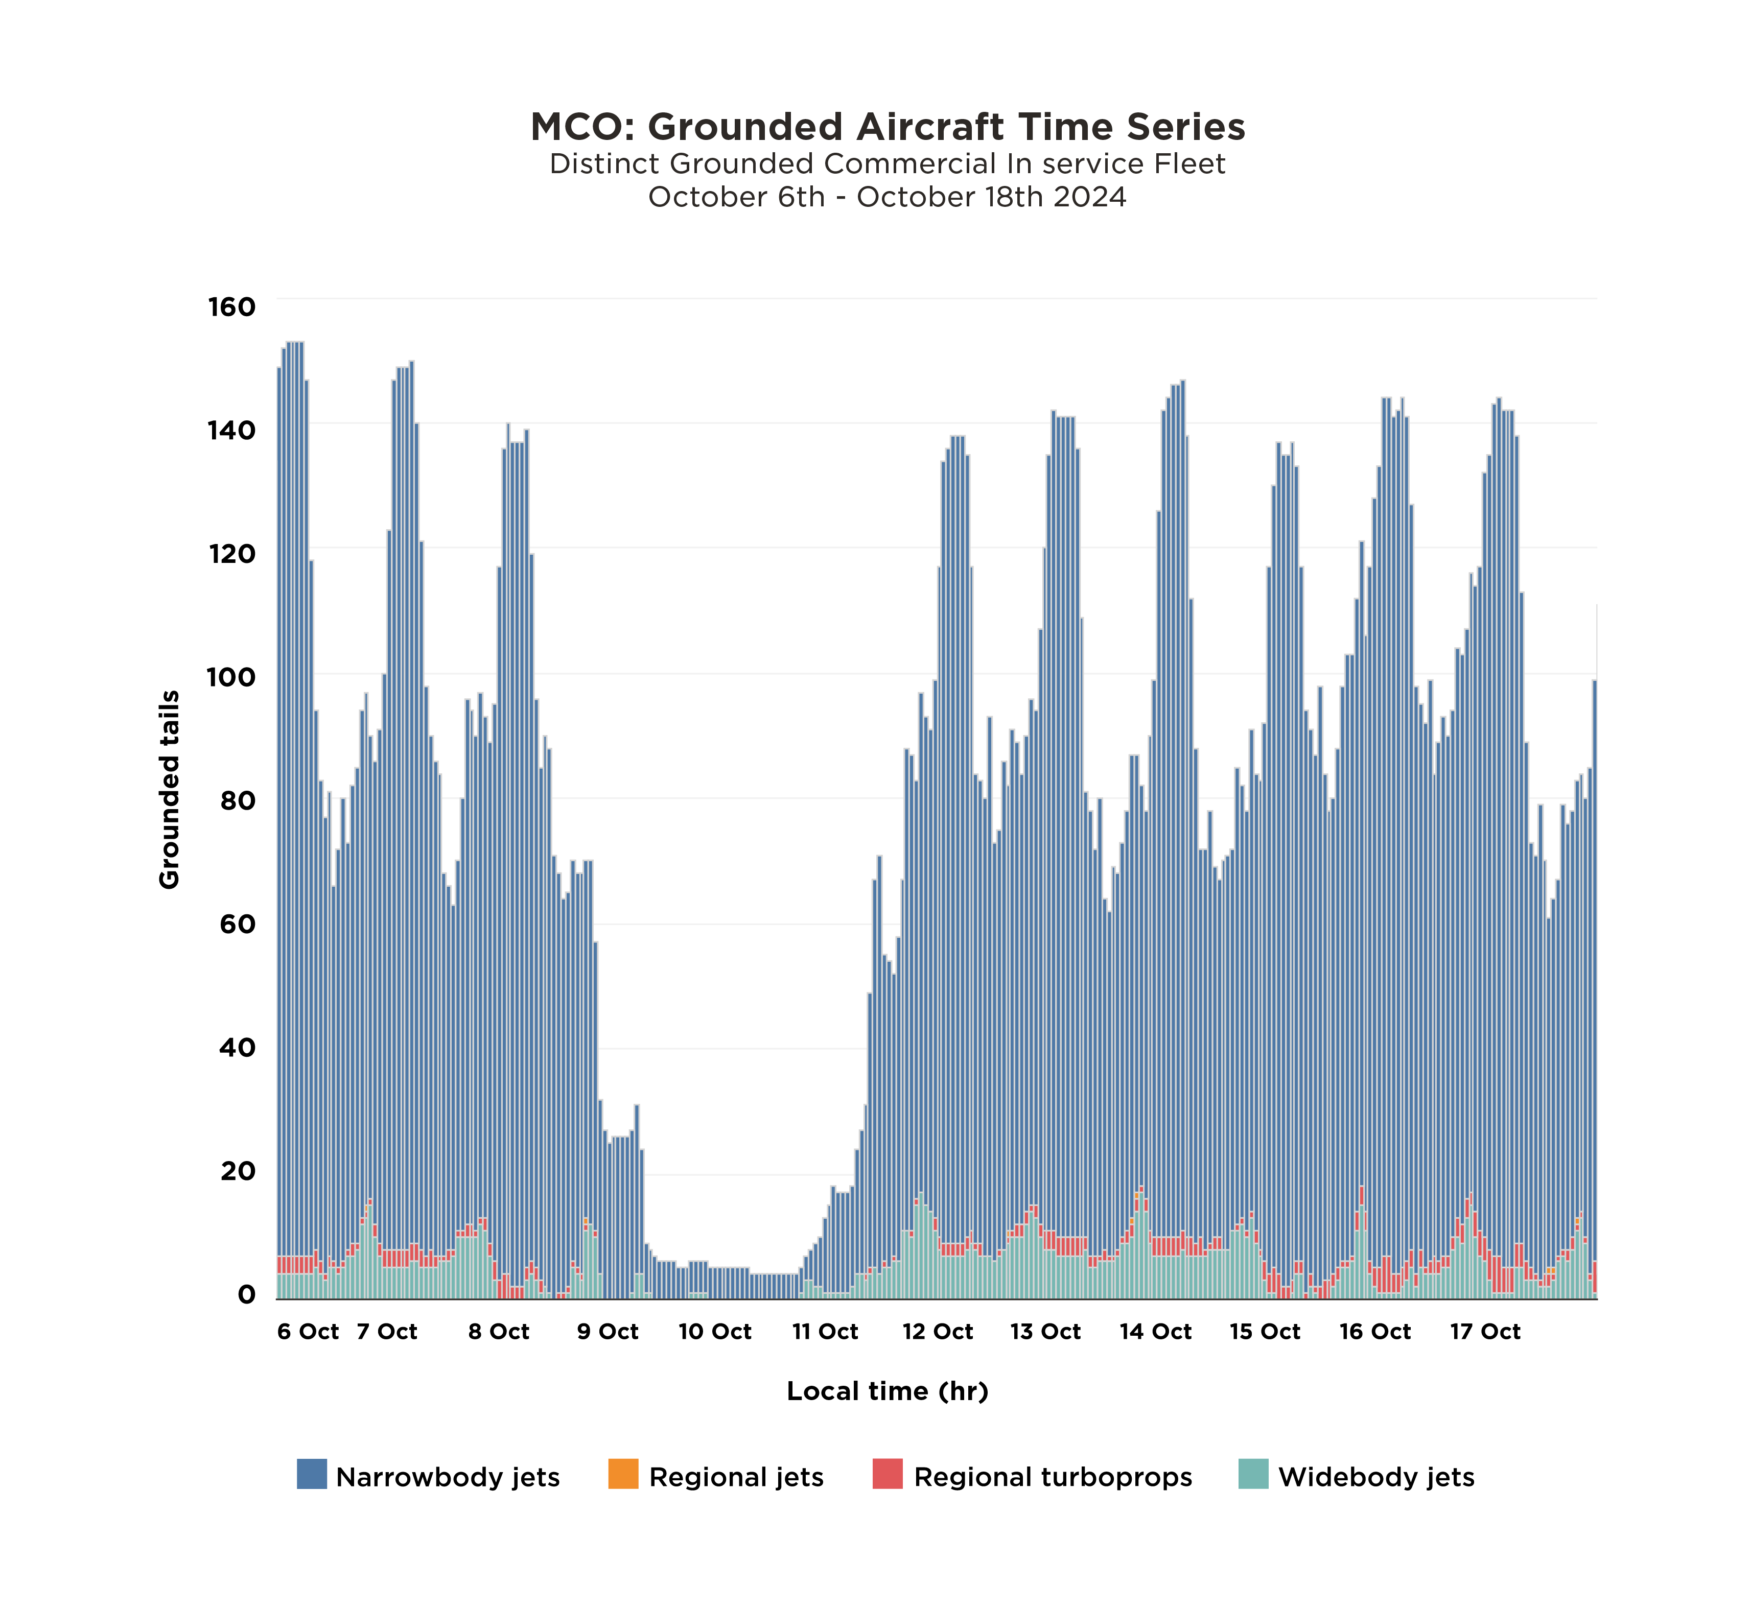
In early October 2024, Hurricane Milton formed over the Gulf of Mexico and accelerated towards Central Florida. On October 7th, Orlando International Airport announced commercial operations would cease on the 9th.
A significant number of aircraft and almost all widebody jets were moved away from MCO in preparation for the storm. The rhythmic daily profile described above disintegrated as normal commercial operations came to a halt.
However, a small population of aircraft remained at MCO as it closed during the storm. Approximately 8-10 narrowbody jets stayed at the airport as the hurricane passed through. Despite some minor damage to facilities, the airport reopened to arrivals on the evening of 10th October, and aircraft quickly returned. Full commercial passenger operations resumed the next day and the daily ground accumulation profile returned to normal one day later on the 12th.
Answering ‘What Ifs’ With Data
The profiling data for MCO serves as just one example of how Cirium’s Tracked Utilization and Ground Accumulation data capabilities can be leveraged to monitor fleet activity. Many questions can be answered with this data: what aircraft are on the ground right now? Which airports accumulate the highest fleet exposure? What does a worst-case exposure scenario look like at a particular airport?
Additionally, what proportion of an airline or lessor’s fleet is grounded at any point in time? How do they typically react during anomalous situations? And whose aircraft are on the ground at a given airport right now?
This article was originally published in Cirium’s Aviation Data in Insurance report. For more insights and analysis into the evolving role of data in aviation insurance, read the full report.