


Thought Cloud
Data analyses, aviation insights, and research curated by Cirium’s experts, Ascend consultancy and data teams.
-
 READ ARTICLE: Widerøe and the discipline behind regional reliability
Widerøe and the discipline behind regional reliability
Widerøe’s on-time performance tells a larger story than a single OTP figure. In one of Europe’s more demanding regional aviation…
-
 READ ARTICLE: Why Emissions Rankings Now Matter More Than Ever for Airlines
Why Emissions Rankings Now Matter More Than Ever for Airlines
From compliance metric to strategic signal: what the latest airline emissions rankings reveal about competitiveness, capital and credibility.
-
 READ ARTICLE: The Monthly On-Time Performance Report – June 2026
The Monthly On-Time Performance Report – June 2026
Global flight reliability held firm as summer disruption intensified in June.
-
 READ ARTICLE: What airline behavior reveals about aerospace demand
What airline behavior reveals about aerospace demand
Airline responses to disruption – from Ryanair’s rapid pandemic recovery to Qatar Airways’ response to geopolitical shocks – reveal how…
-
 READ ARTICLE: May 2026 – Southeast Asia On-Time Performance Monthly Report
May 2026 – Southeast Asia On-Time Performance Monthly Report
Asia-Pacific accounted for 59% of global cancellations in May, yet Southeast Asian airlines improved OTP by nearly 8 points.
-
 READ ARTICLE: Born Efficient: The JetSMART Story
Born Efficient: The JetSMART Story
Most airlines spend years working toward a younger, cleaner fleet. JetSMART decided to build one from the start.
-
 READ ARTICLE: Aviation and event-driven demand: The economics of World Cup tourism
Aviation and event-driven demand: The economics of World Cup tourism
As the aviation industry prepares for the FIFA World Cup 2026 hosted across North America, demand, geopolitics, and the wider…
-
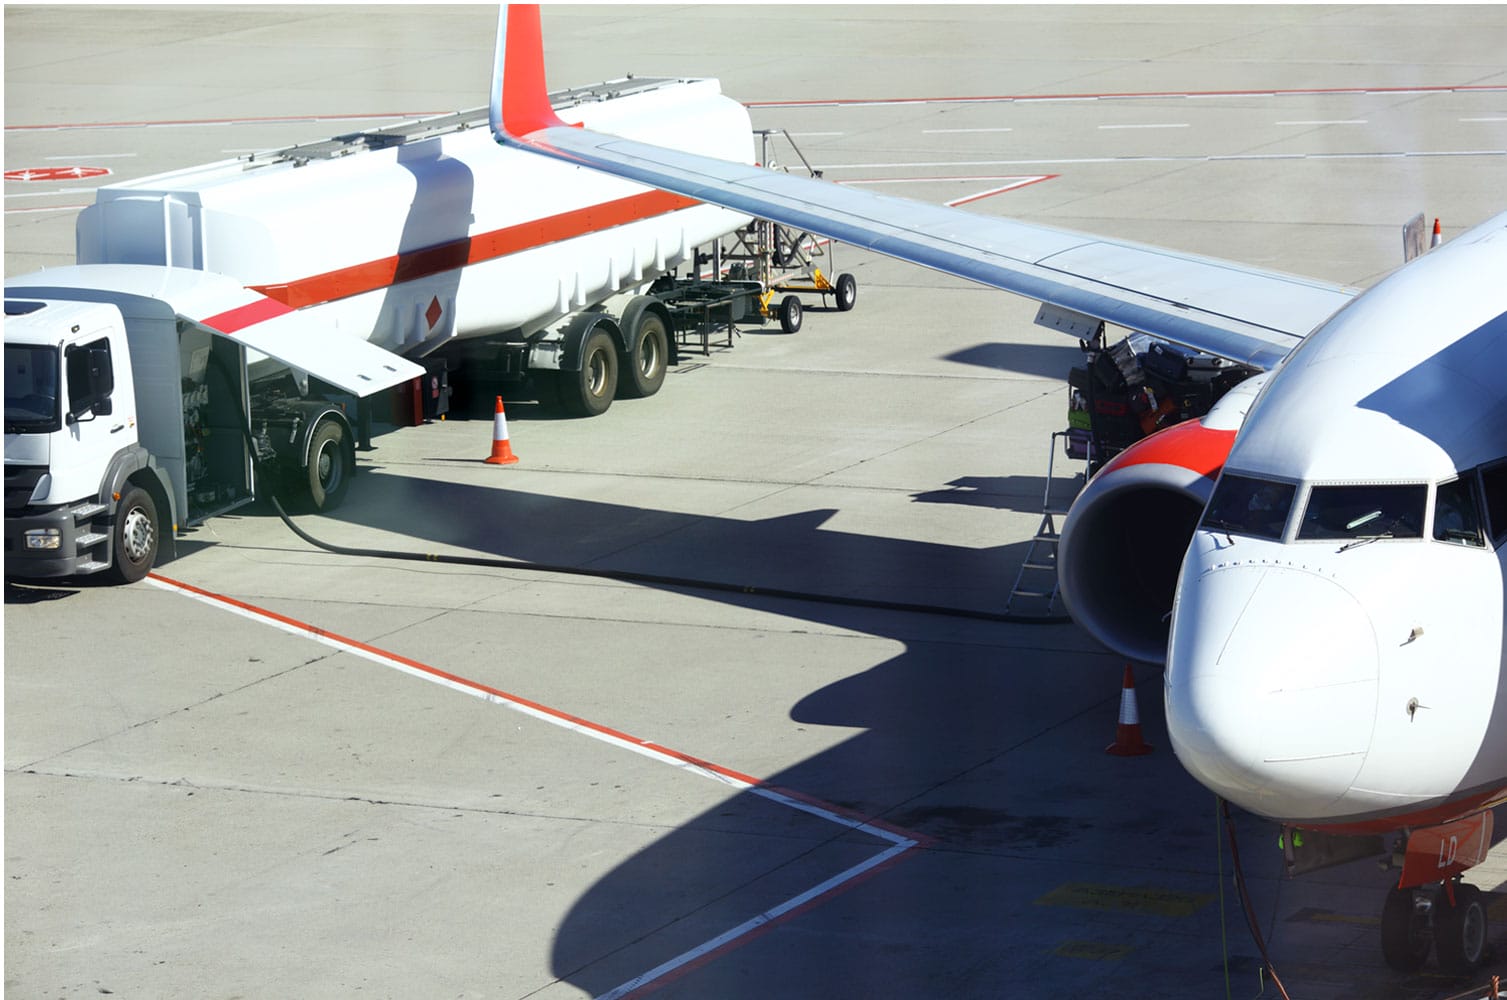 READ ARTICLE: Airlines weather fuel price volatility after Gulf shock
Airlines weather fuel price volatility after Gulf shock
Have energy markets managed to sidestep jet fuel shortages? ICIS markets editor Shruti Salwan and Cirium air transport reporter Jonathan…
-
 READ ARTICLE: How Air Europa is Approaching Emissions Reduction
How Air Europa is Approaching Emissions Reduction
An inside look at the airline’s emissions journey, the practices behind its progress, and the road to its 2030 target.
-
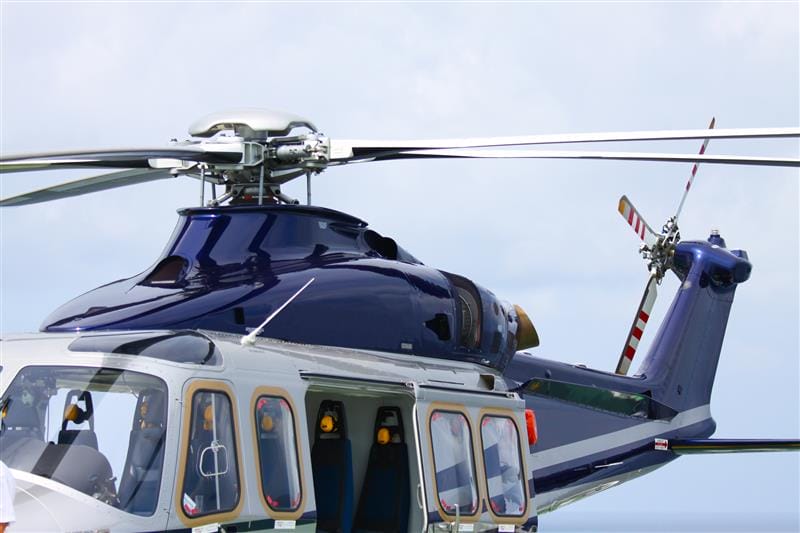 READ ARTICLE: Intermediate twin helicopters: Market trends and value review insights
Intermediate twin helicopters: Market trends and value review insights
Intermediate twin-engine helicopters are becoming an increasingly important part of the global helicopter market. Eleni Maragkou examines fleet, value and…
-
 READ ARTICLE: Europe braces for severe jet fuel crunch before summer rush
Europe braces for severe jet fuel crunch before summer rush
What will diminishing jet fuel inventories mean for the summer air travel peak? ICIS Markets Editor Shruti Salwan and Cirium…
-
 READ ARTICLE: Philippine Airlines — Asia Pacific’s Rising Star
Philippine Airlines — Asia Pacific’s Rising Star
The flag carrier’s climb to the top of the on-time rankings tells a bigger story about ambition, leadership, and an…

Stay in the loop – receive new Cirium reports, updates, and analyses
Be the first to know about new complimentary Cirium reports, like the On-Time Performance Report, travel and aviation research, case studies and more.